Decision-grade underwriting, pricing, risk, and performance intelligence for energy infrastructure capital.
Forward-looking, hyperlocal, asset-specific risk and performance intelligence — built for the lenders, insurers, and equity financing the next $9 trillion of energy infrastructure.
Infrastructure is being repriced. The analytics underneath haven’t caught up.
“Today’s coverage gaps are tomorrow’s uninsured exposure, are next year’s loan defaults, are the year-after’s equity underperformance.”
Three silos of co-dependent capital, operating on incompatible data.
Insurer, lender, and equity each finance the same physical asset — yet model risk in incompatible languages, on incompatible horizons, with incompatible data. The translation between them is lossy, and the analytical foundation of the trillion-dollar decisions on top of it is built on a foundation whose joints don’t hold.
Insurer
1 yearLender
5–7 yearsEquity
20+ yearsWhat’s needed is not a better point tool. What’s needed is a coherent analytical layer underneath all three.
One spine. Three workflows.
The hazard exposure that surfaces a red flag in Evaluate drives the DSCR stress in Manage and prices the parametric trigger in Mitigate. Change one assumption — a different panel spec, an added battery, a new debt structure, a hardening investment — and every downstream view re-computes against the same underlying scenario. Scenario analysis isn’t bolted on; it’s how the workflow works.
Triage a portfolio or pipeline in hours. InfraRisk scoring + hazard heatmaps + red-flag detection across every U.S. utility-scale plant.
Asset-level hazard decomposition + probabilistic generation + bankability stress + insurance gap. Built the position you defend in IC.
Price parametric structures + optimize coverage layers + quantify resilience ROI — all calibrated against the same modeled risk surface.
Evaluate
Screen + CompareTop-of-funnel diligence at portfolio scale. You leave with an evidence-grounded prioritization — not a recommendation, an answer to which assets deserve the underwriting time.
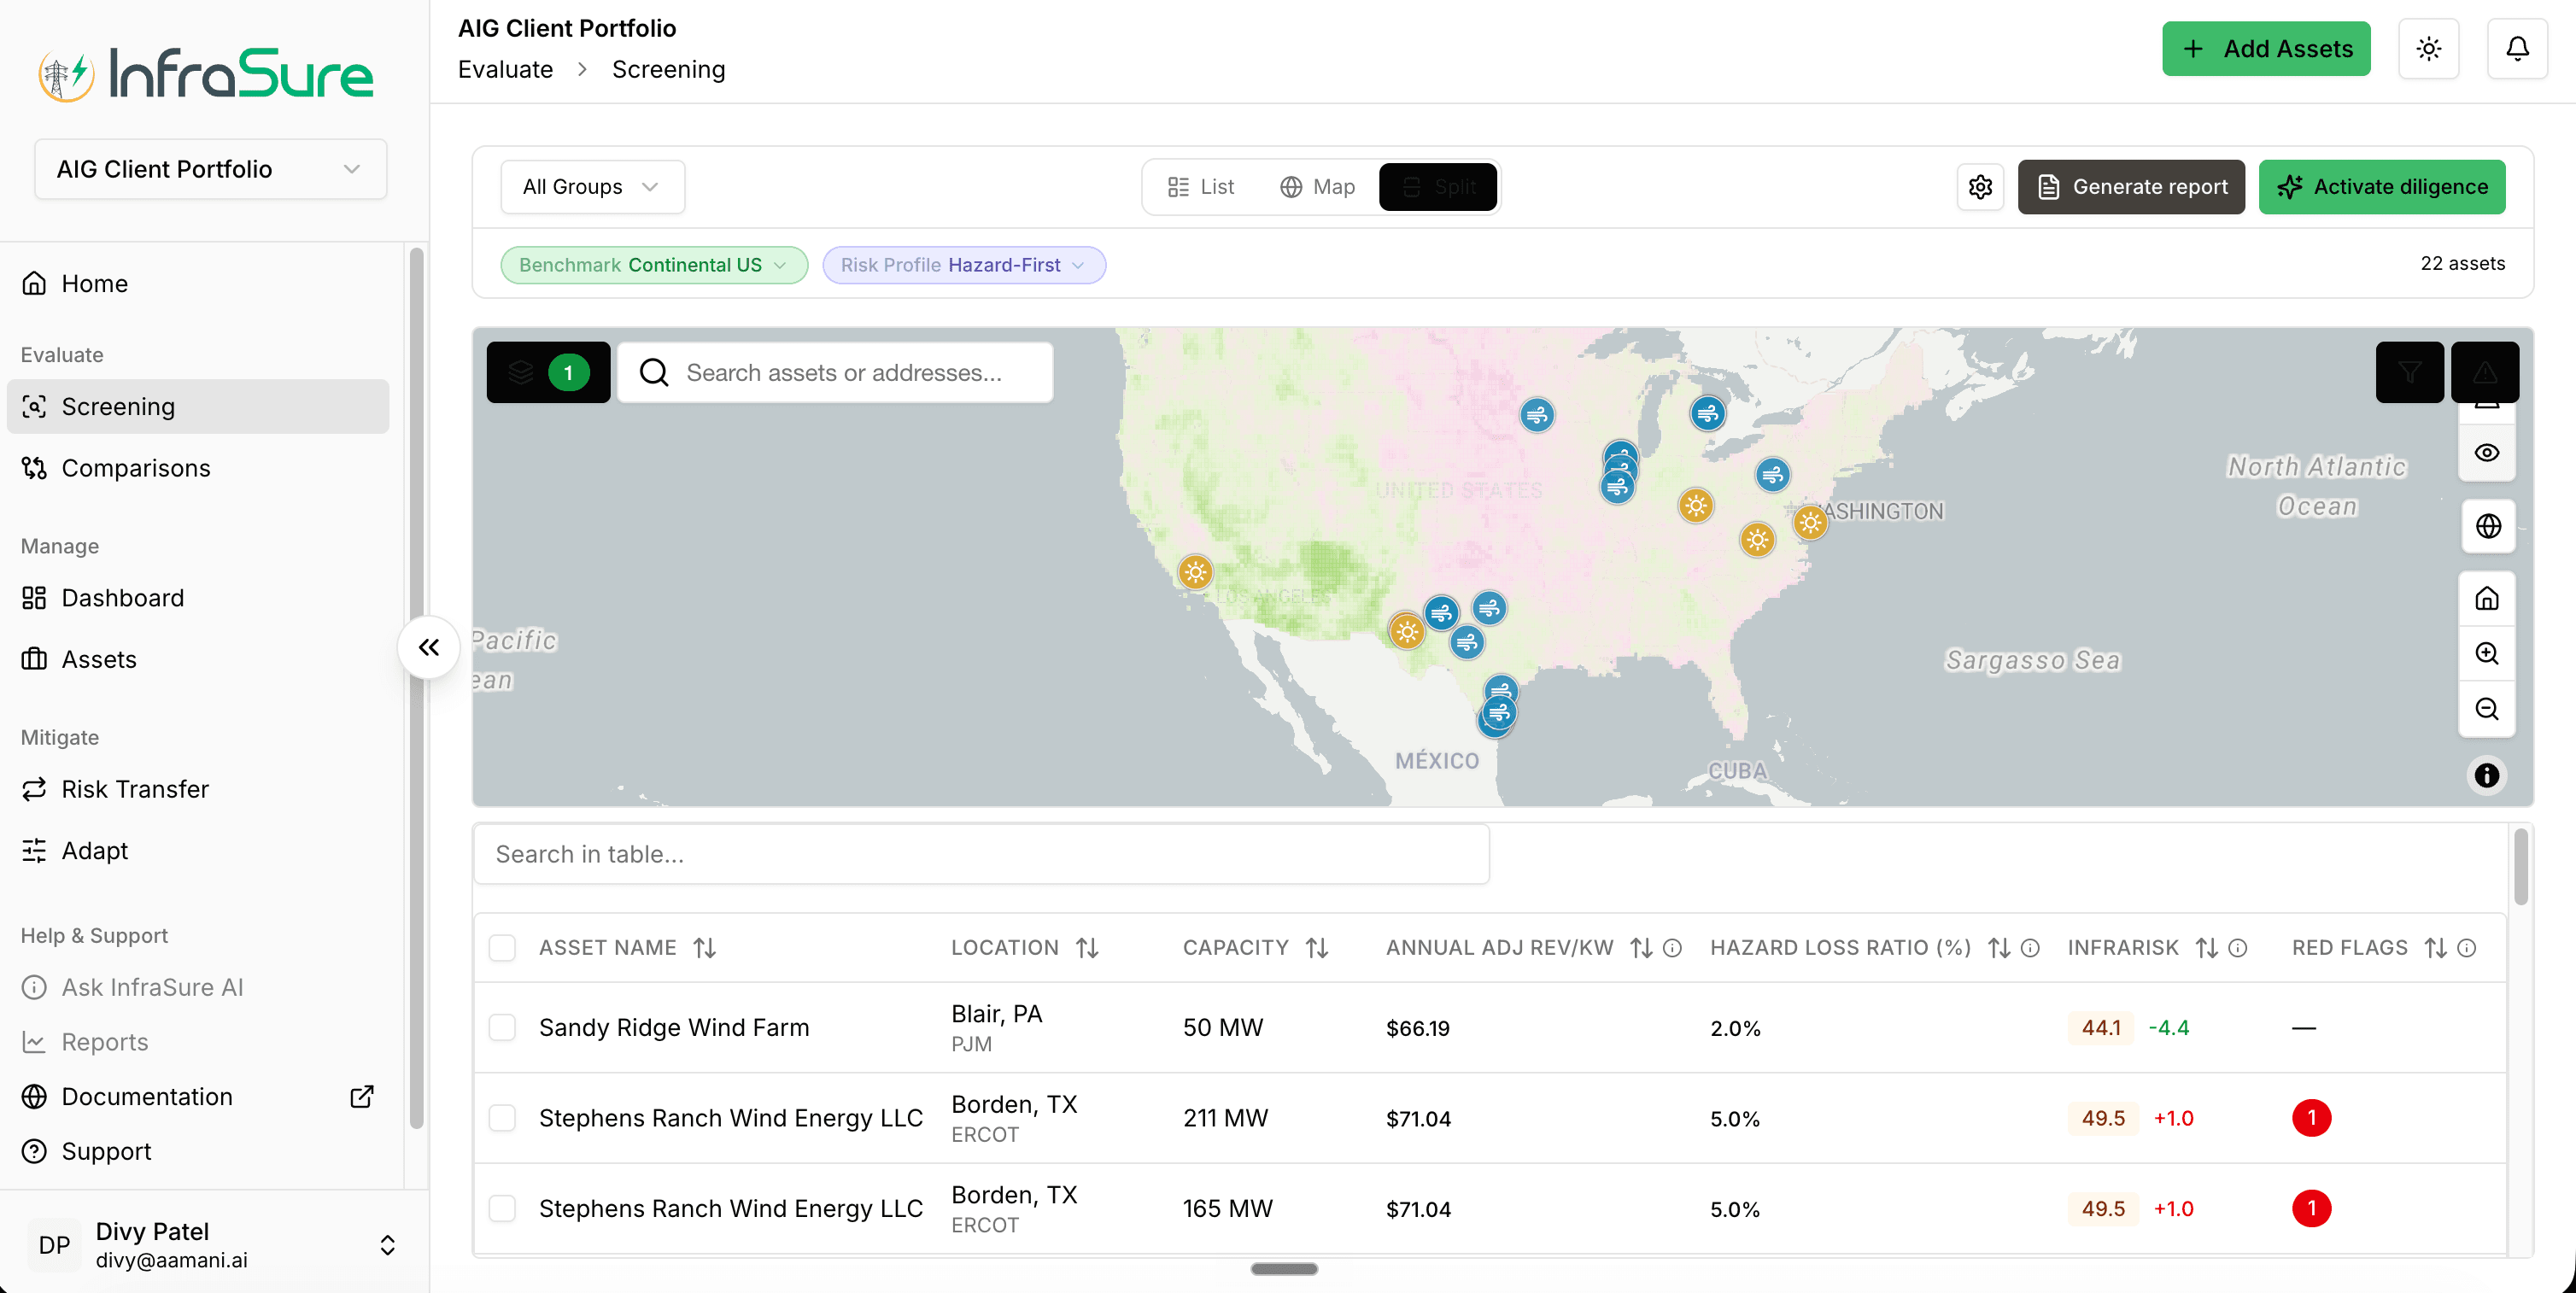
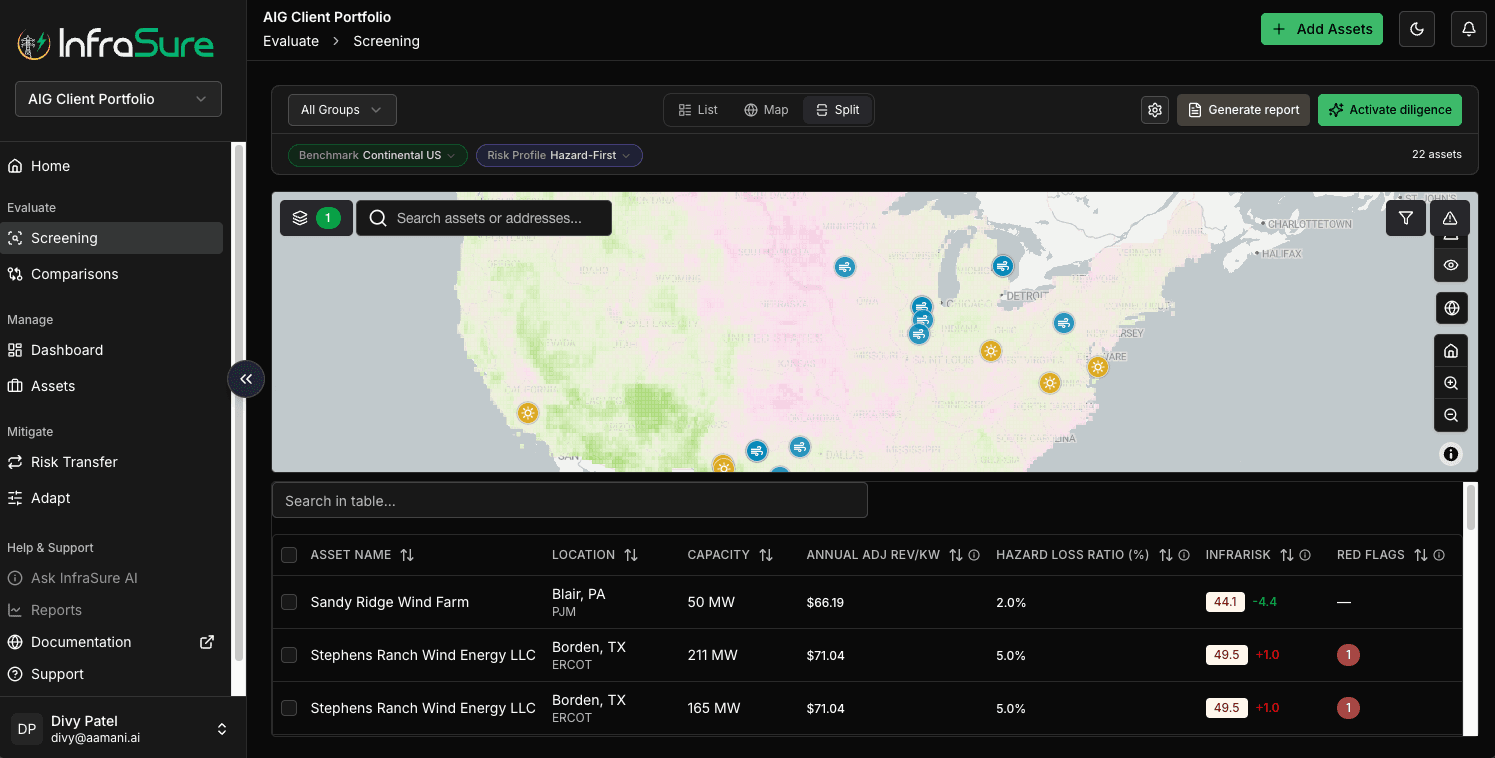
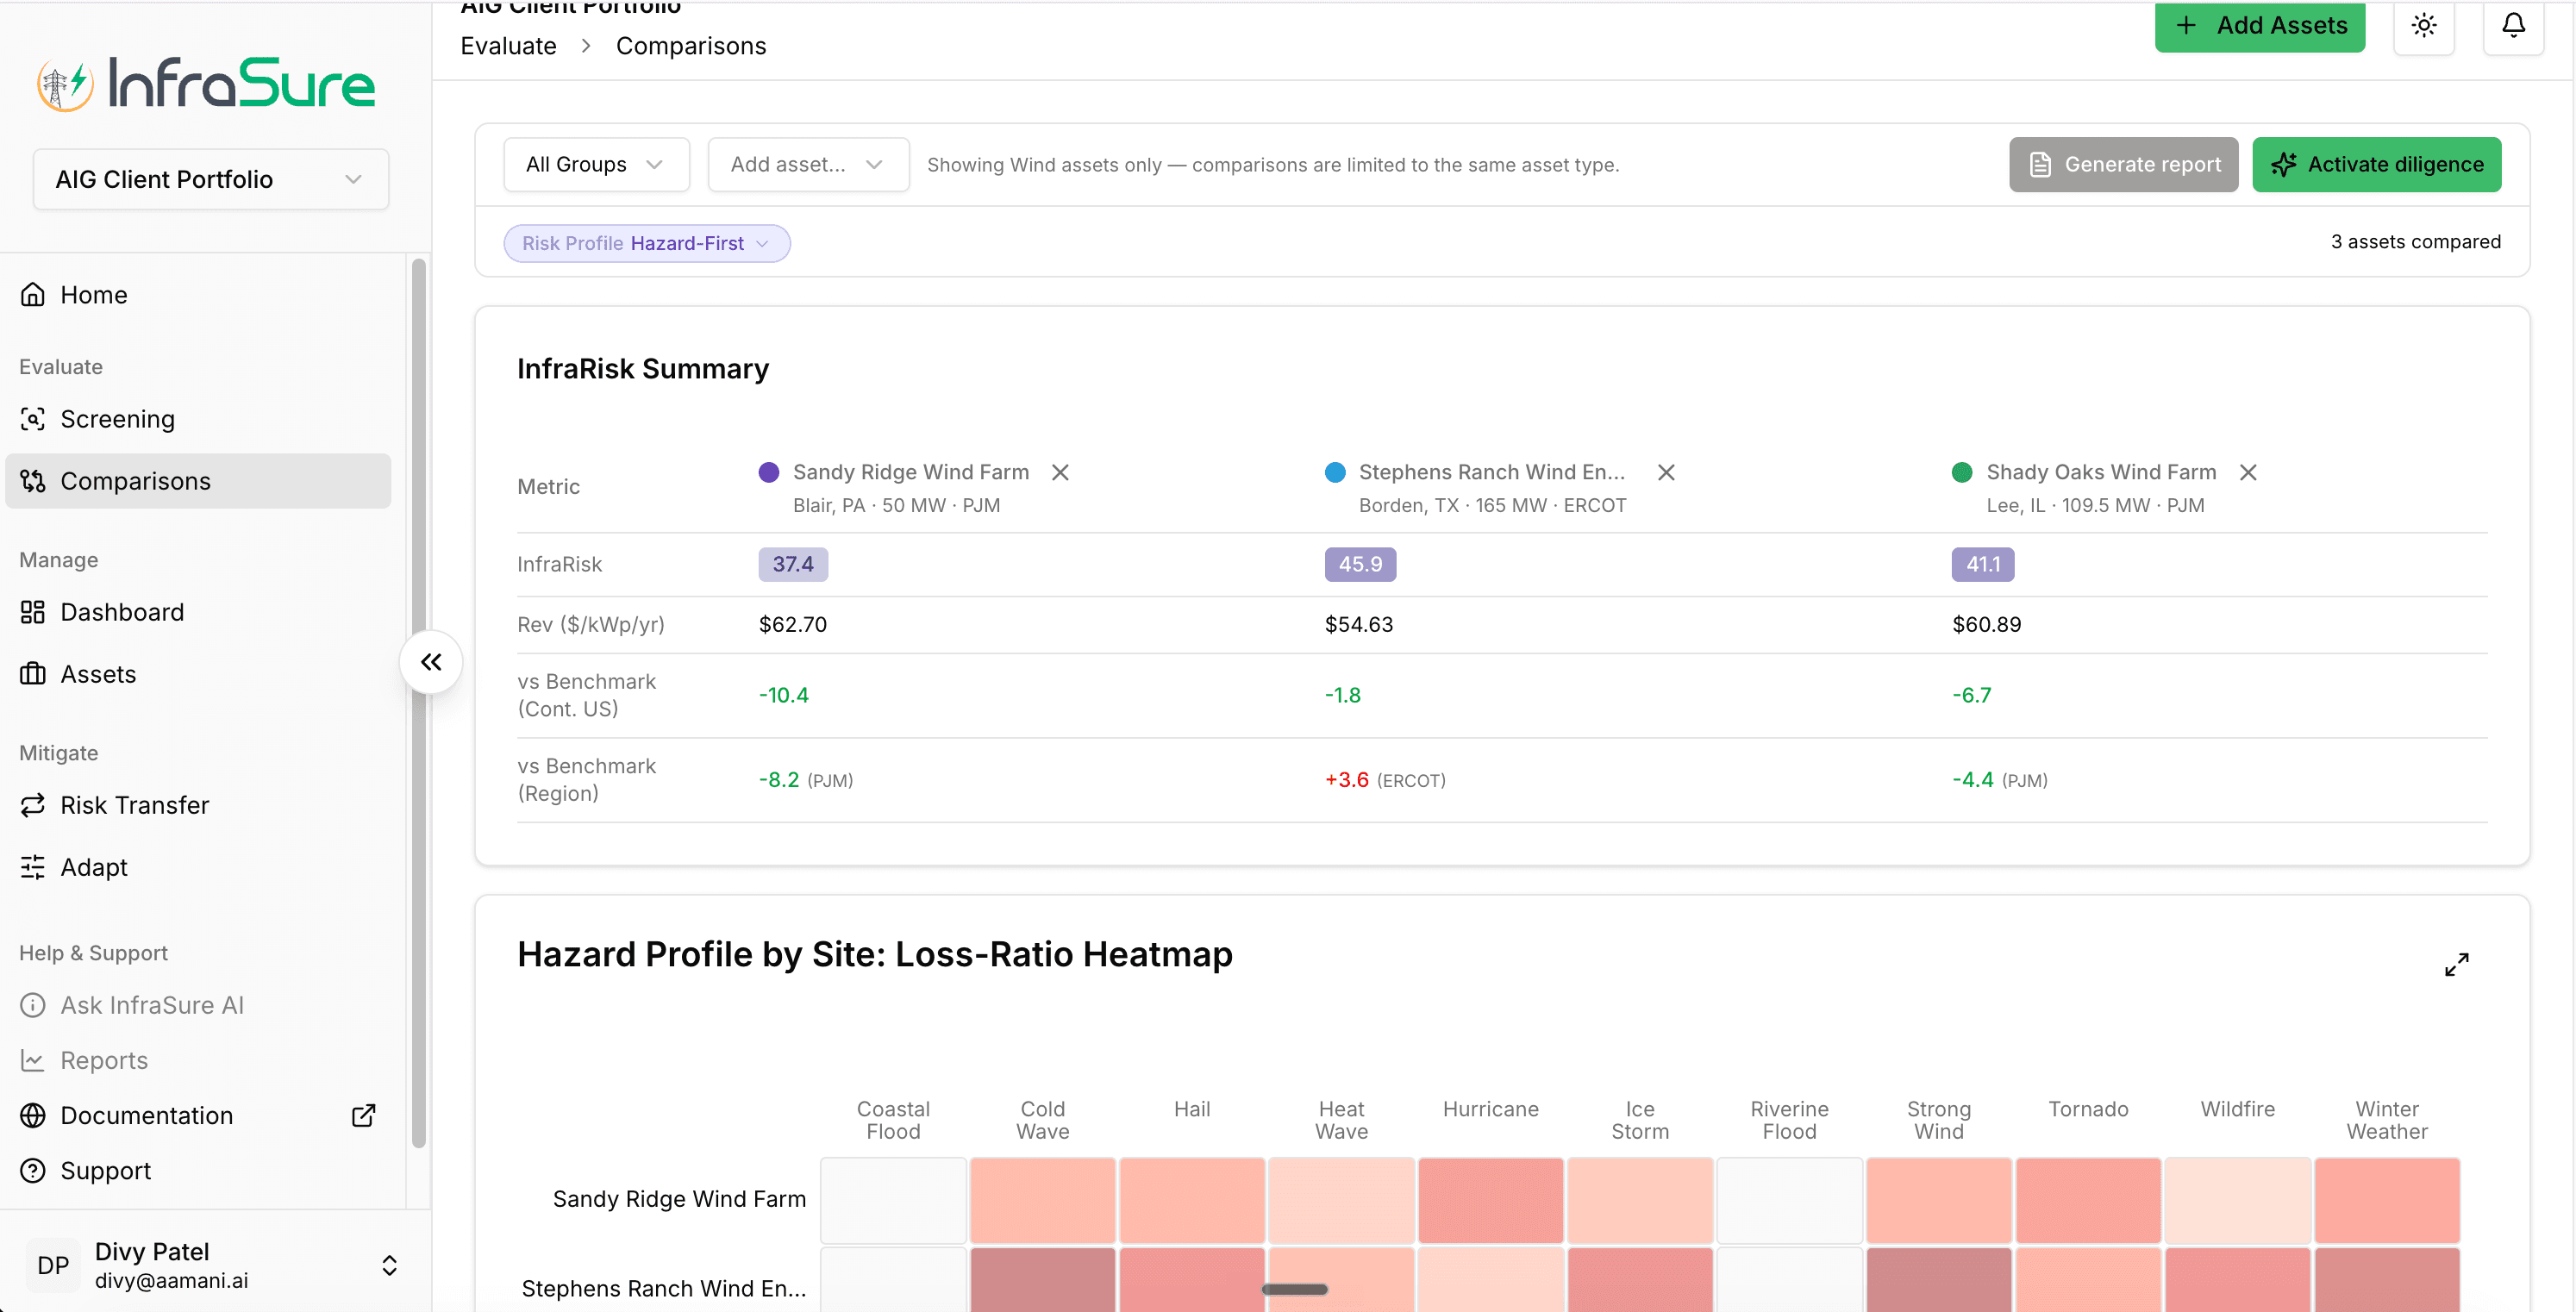
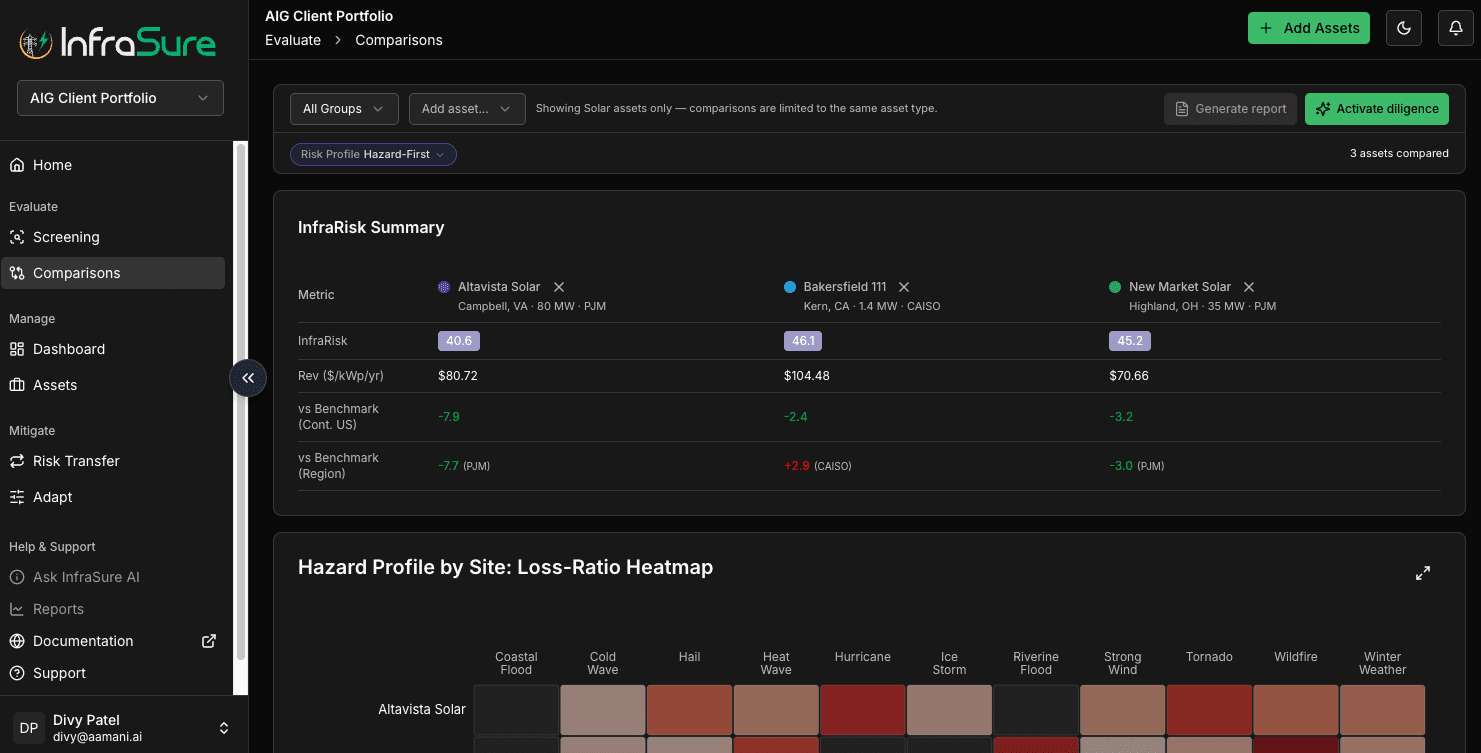
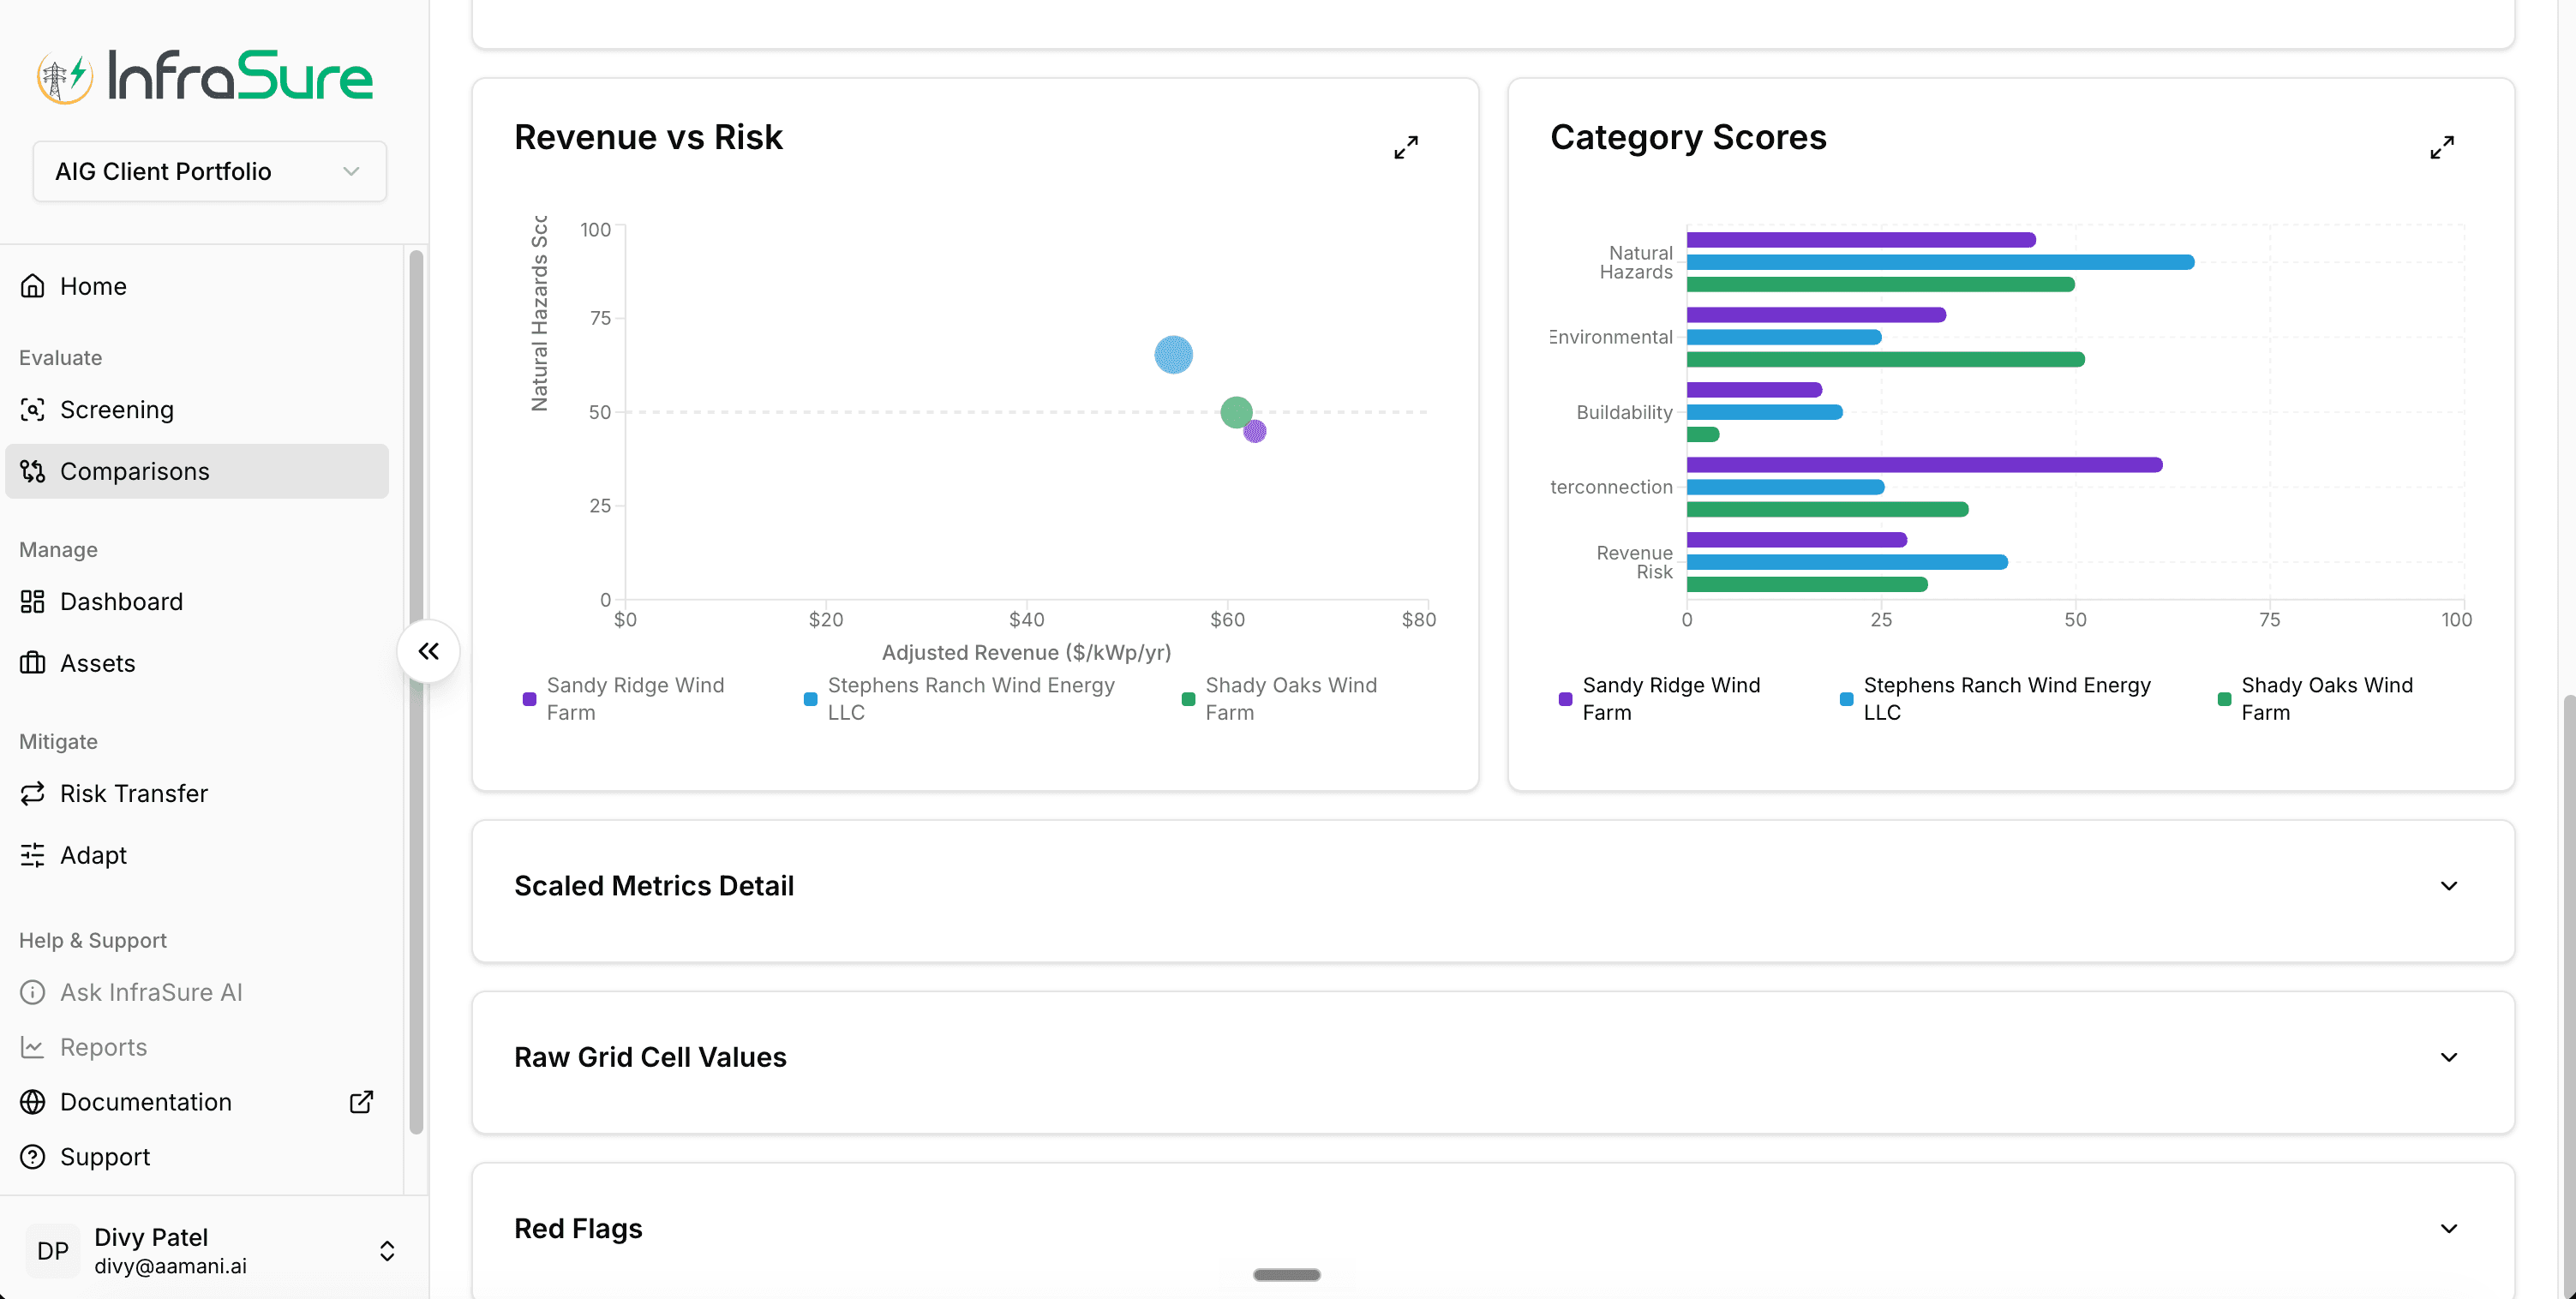
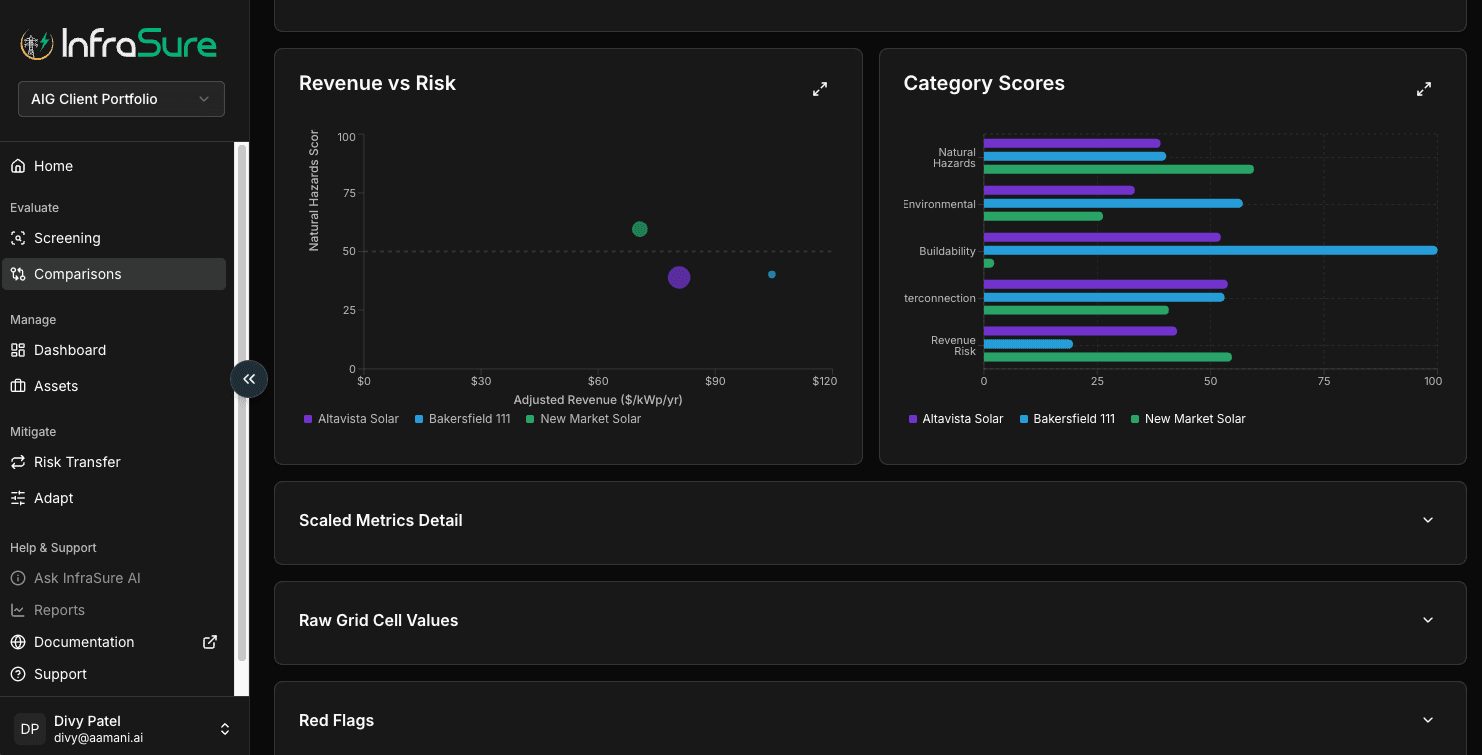
The output is not a recommendation. It's a prioritization — which assets in the set deserve the underwriting time you do not have to spare.
Manage
Underwrite + StructureWhen a specific asset matters, Manage is the workflow that earns the depth. The position you defend in front of an investment committee — not a score.
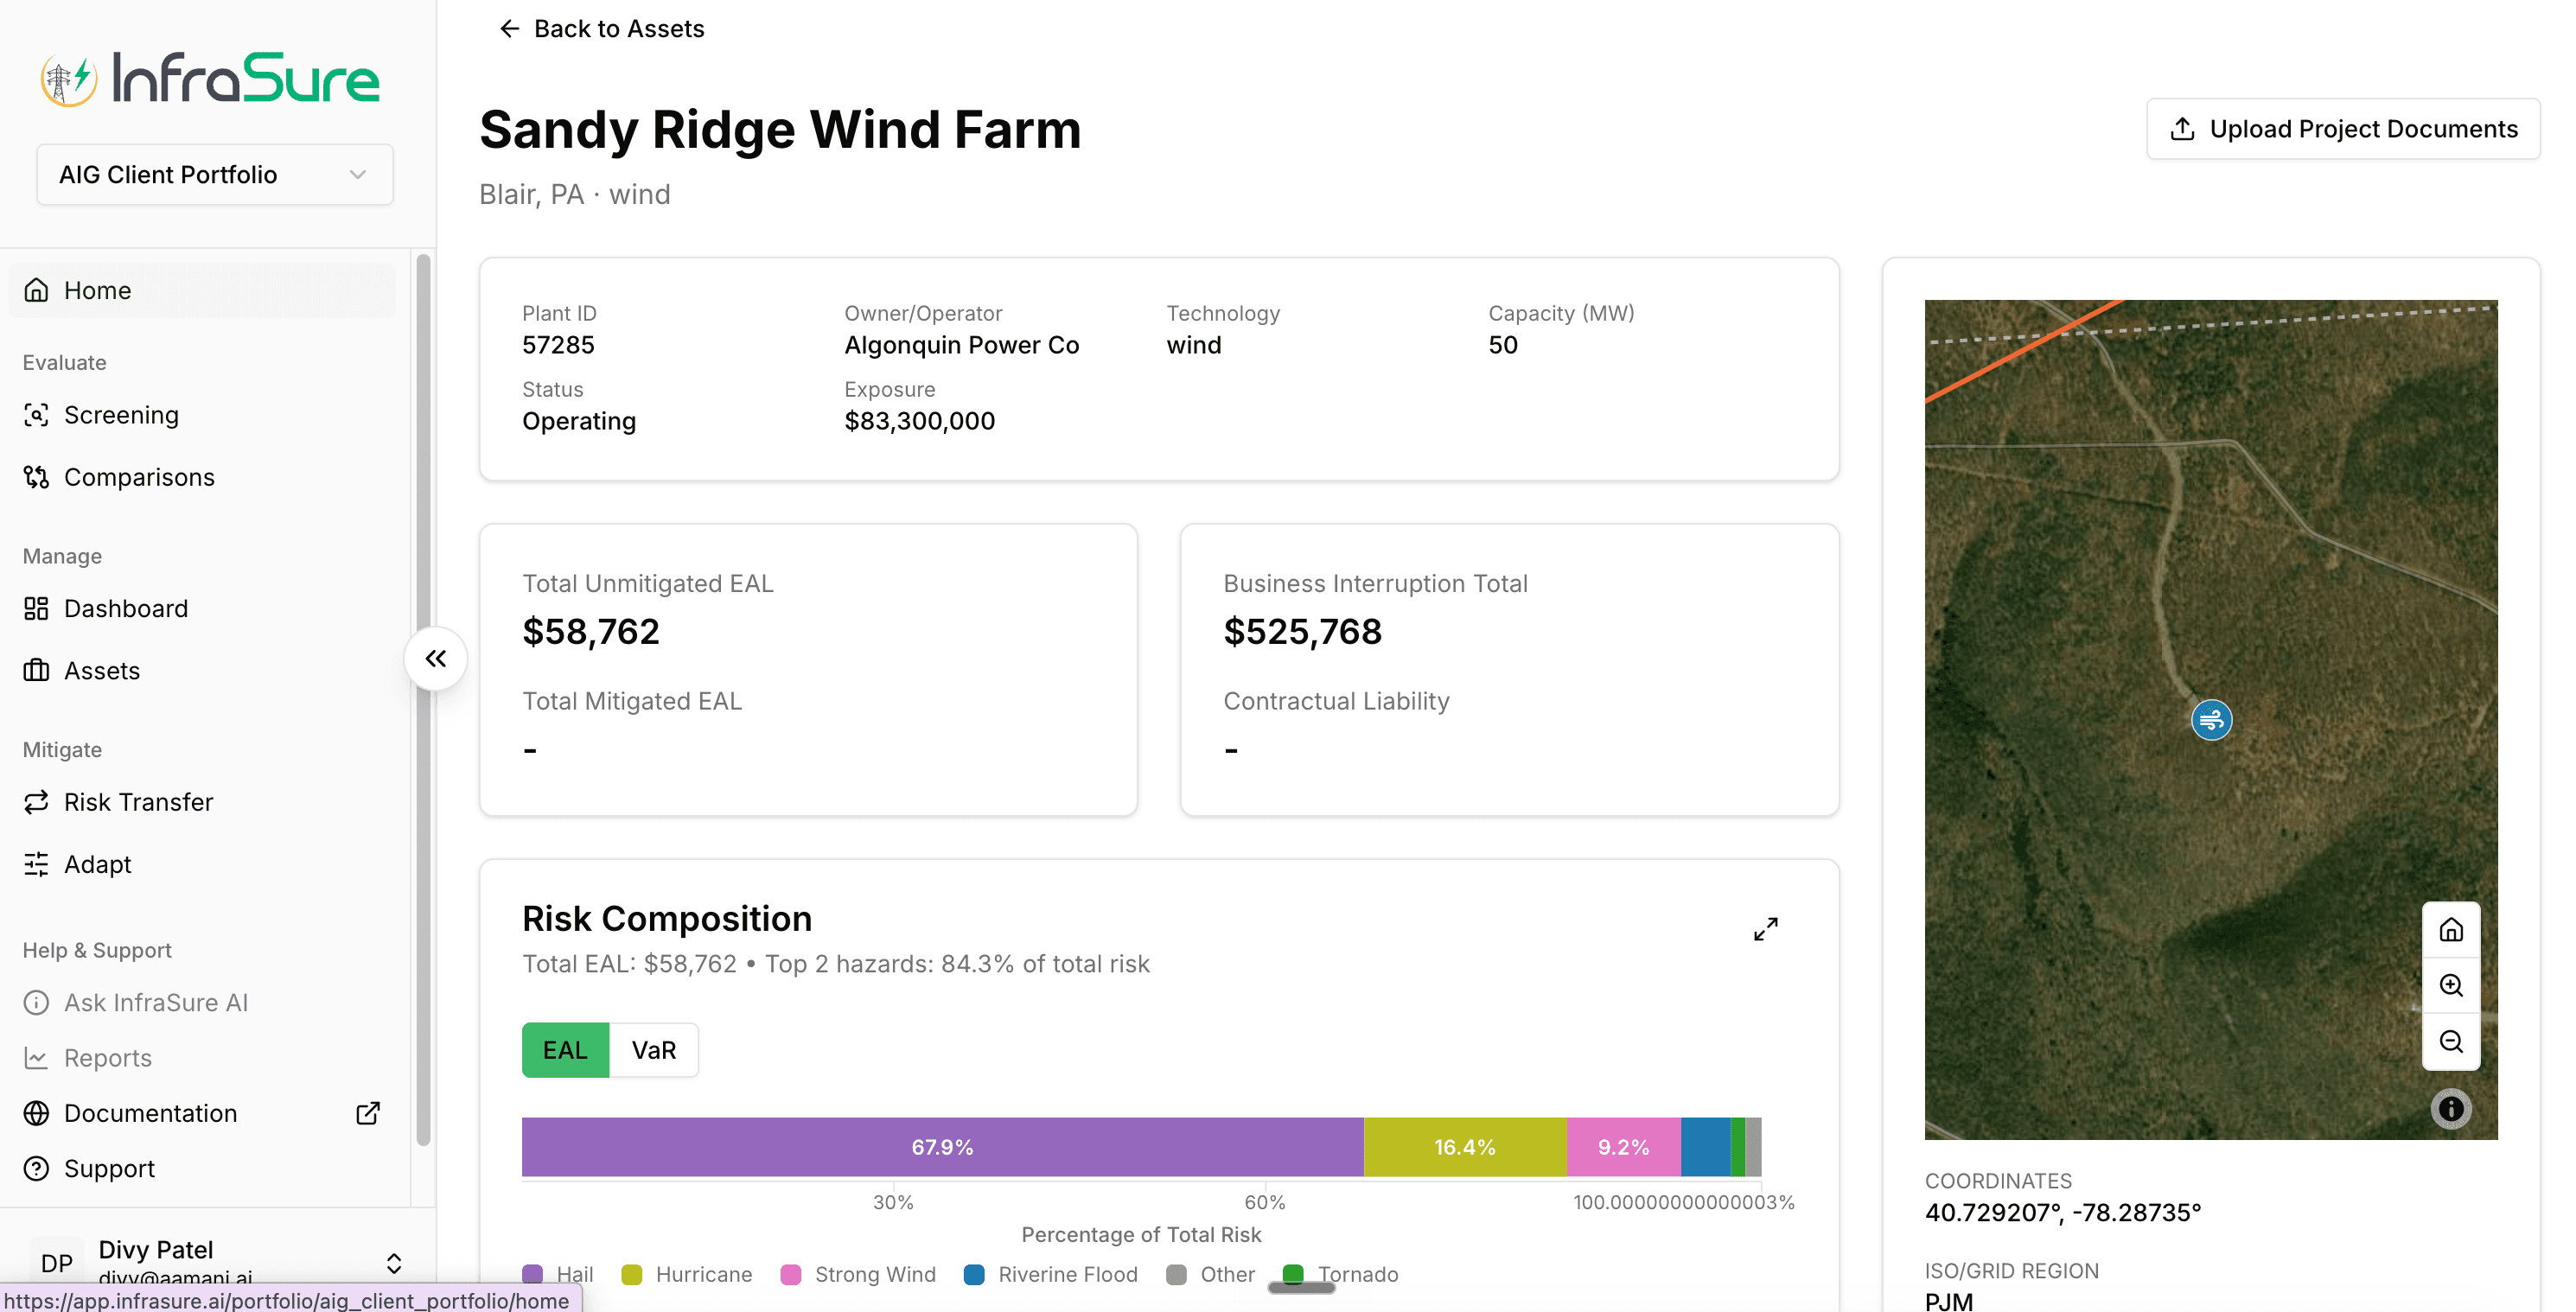
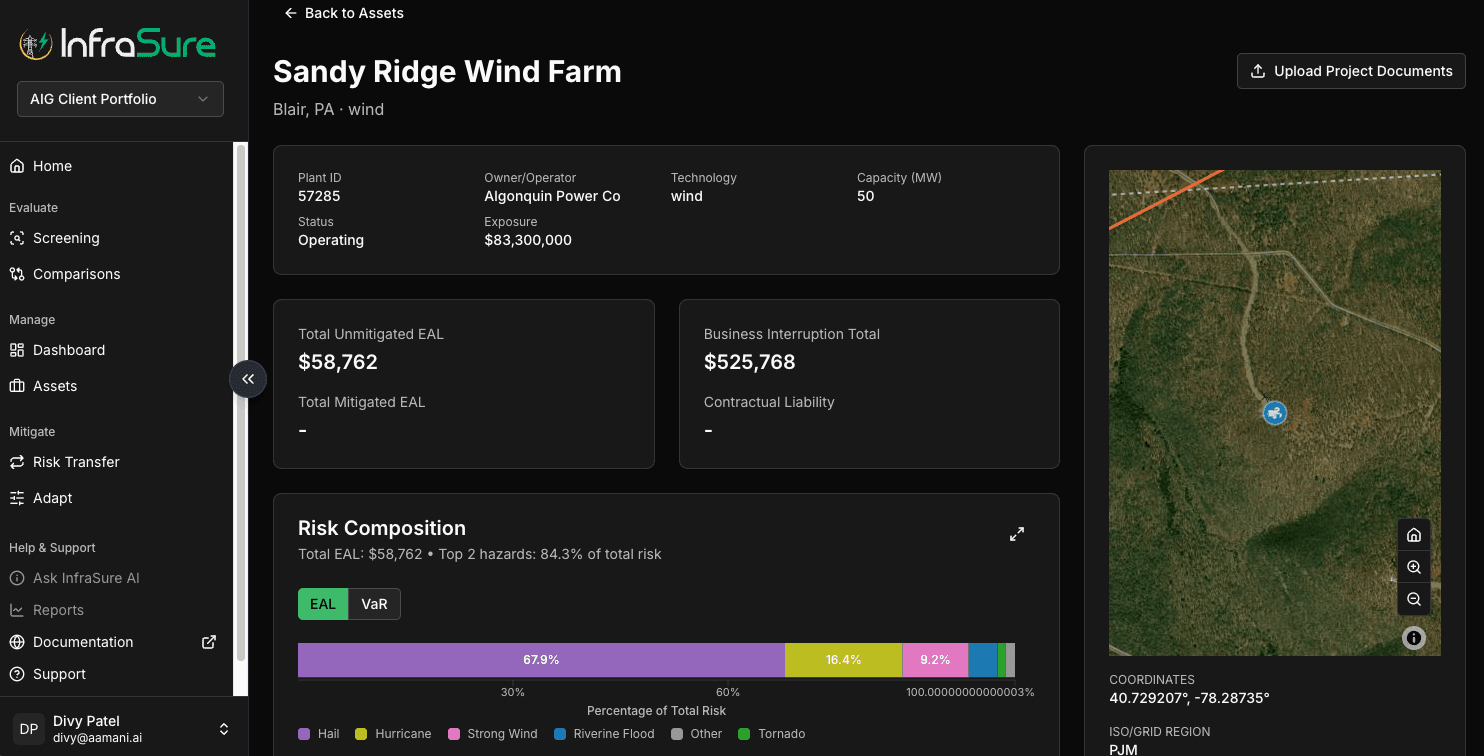
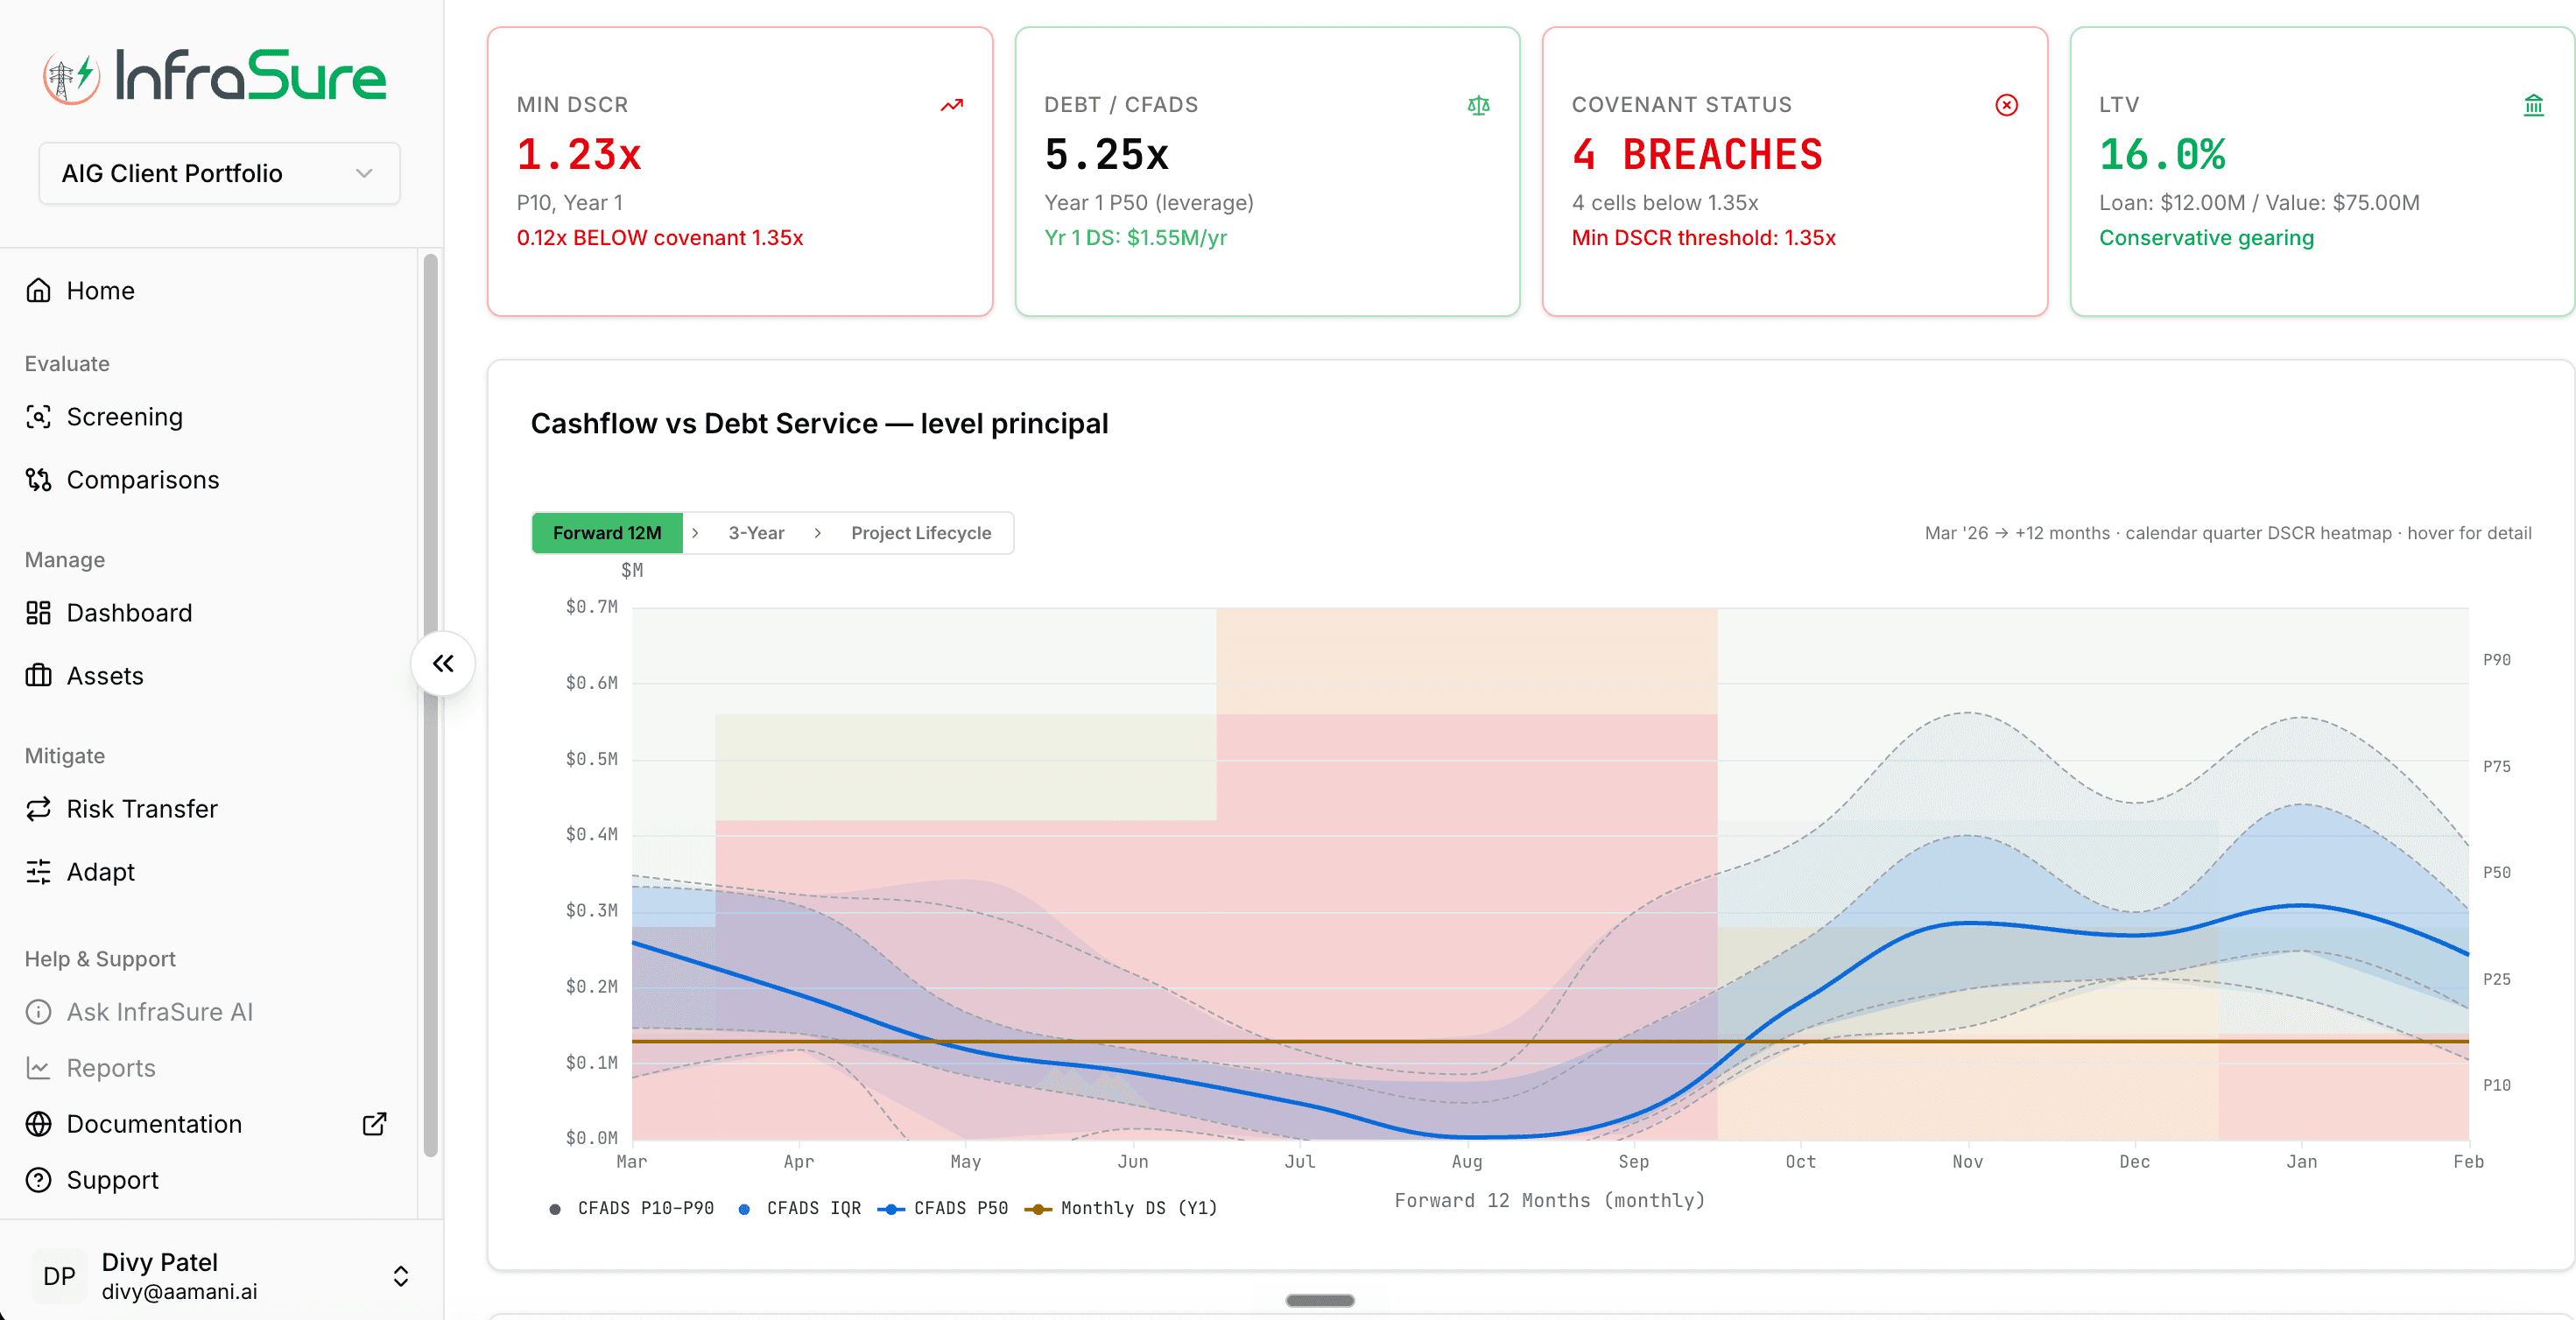
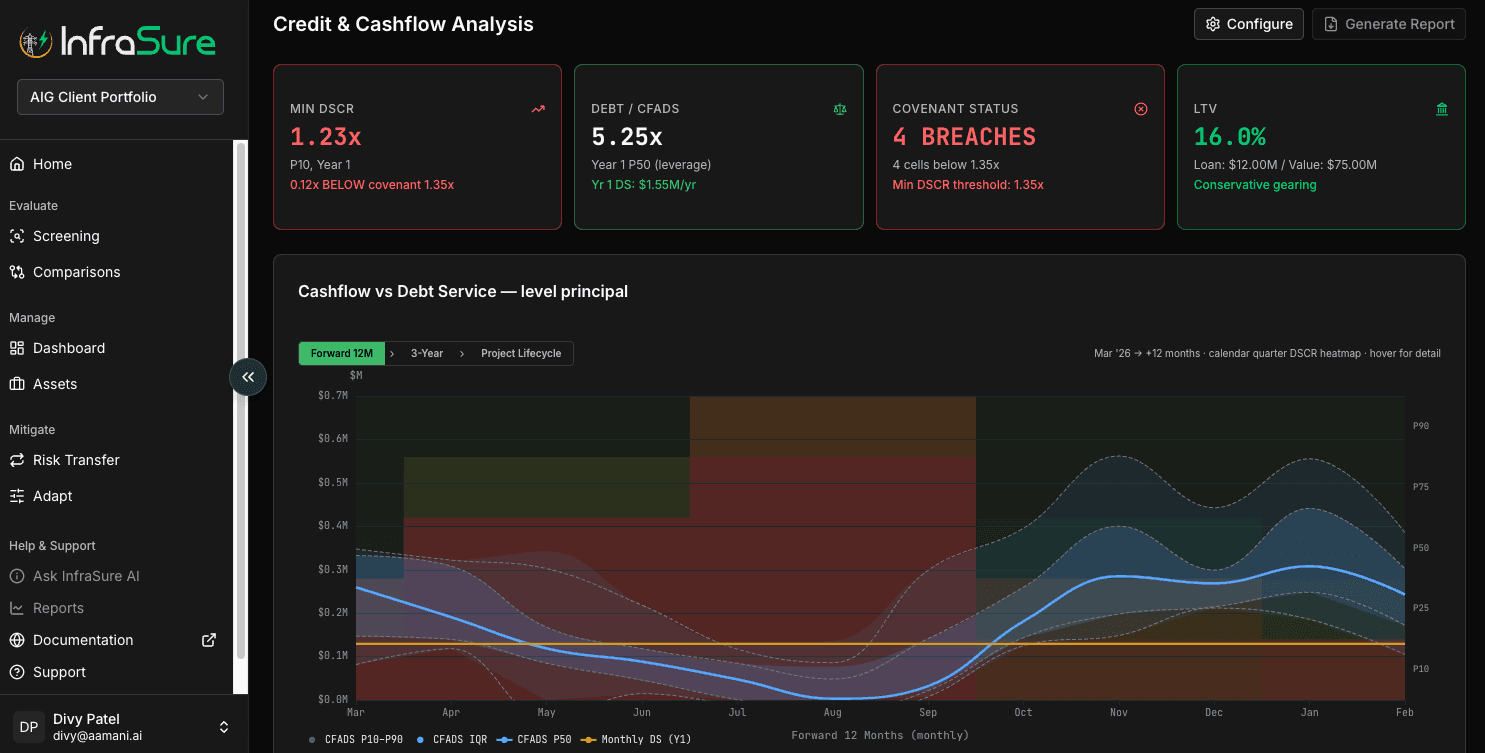
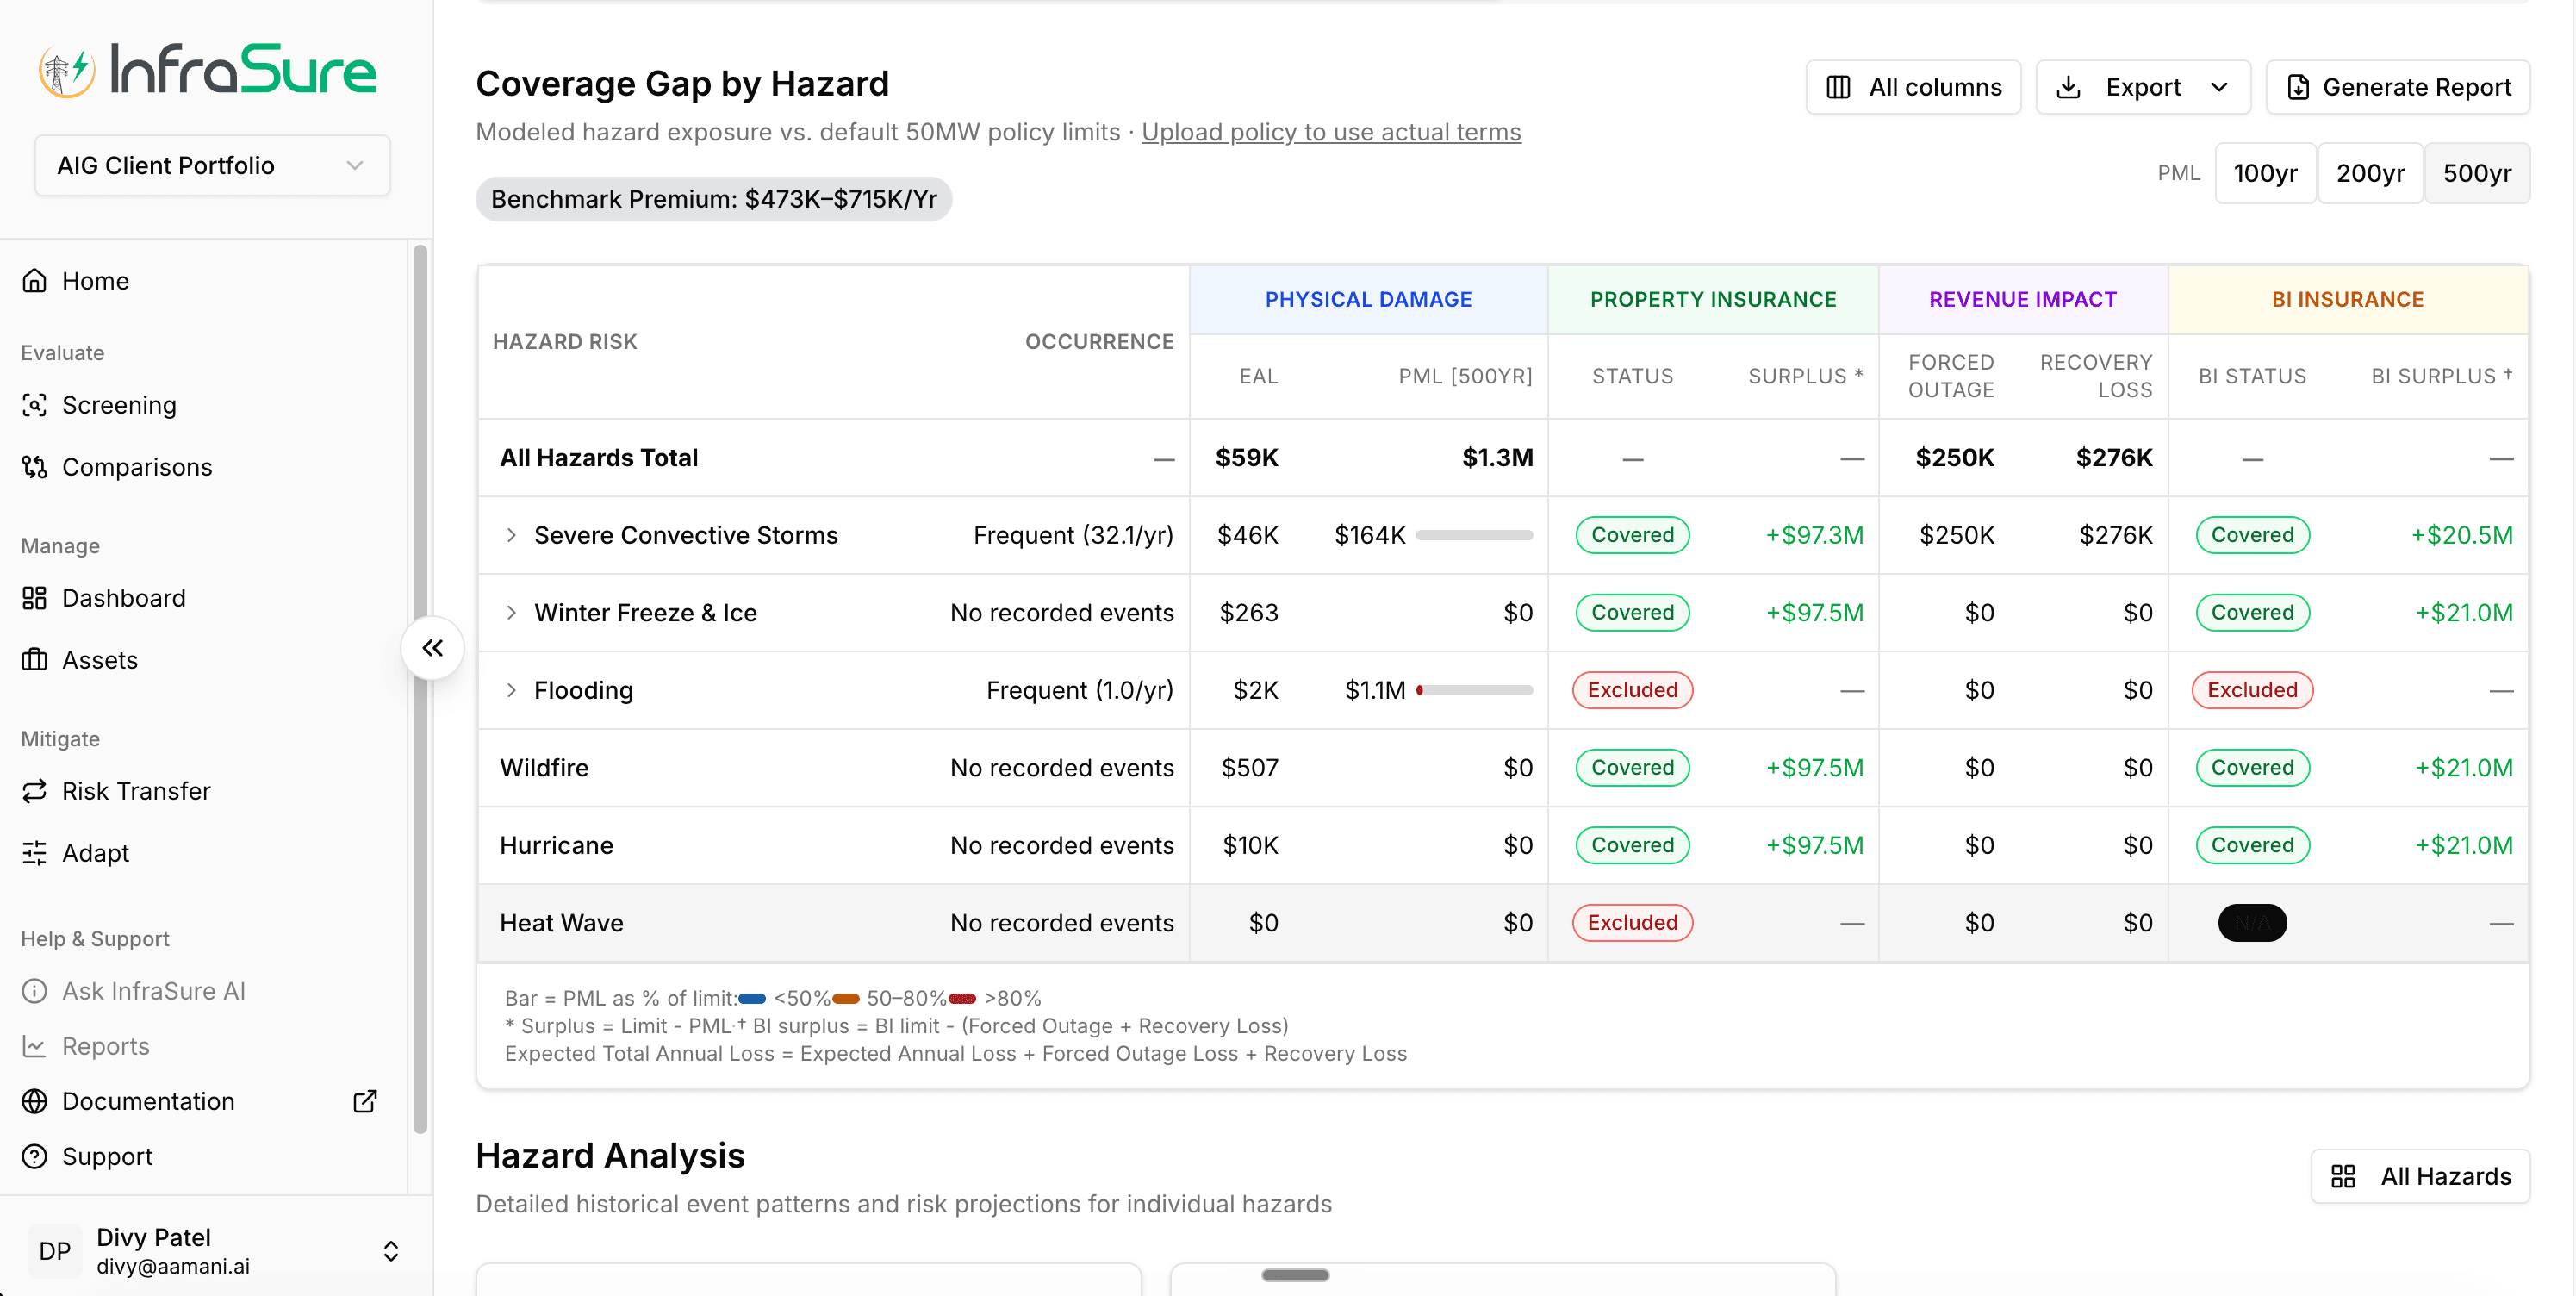
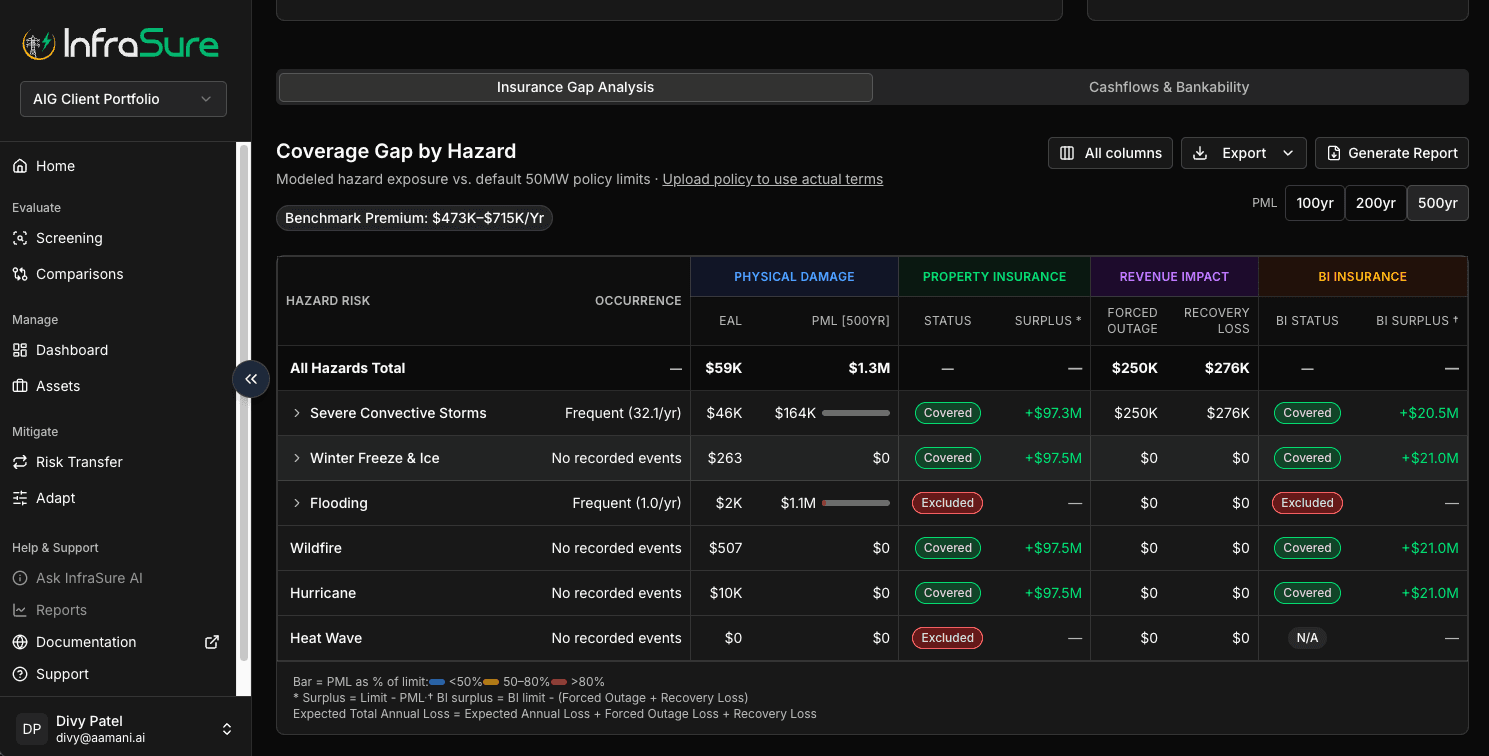
The output is not a score. It's a position — a coherent, defensible read of the asset's economics and risk profile that the customer can act on.
Mitigate
Transfer + AdaptWhere analytical clarity becomes financial action. The same hazard distribution that drove the DSCR stress prices the parametric trigger.
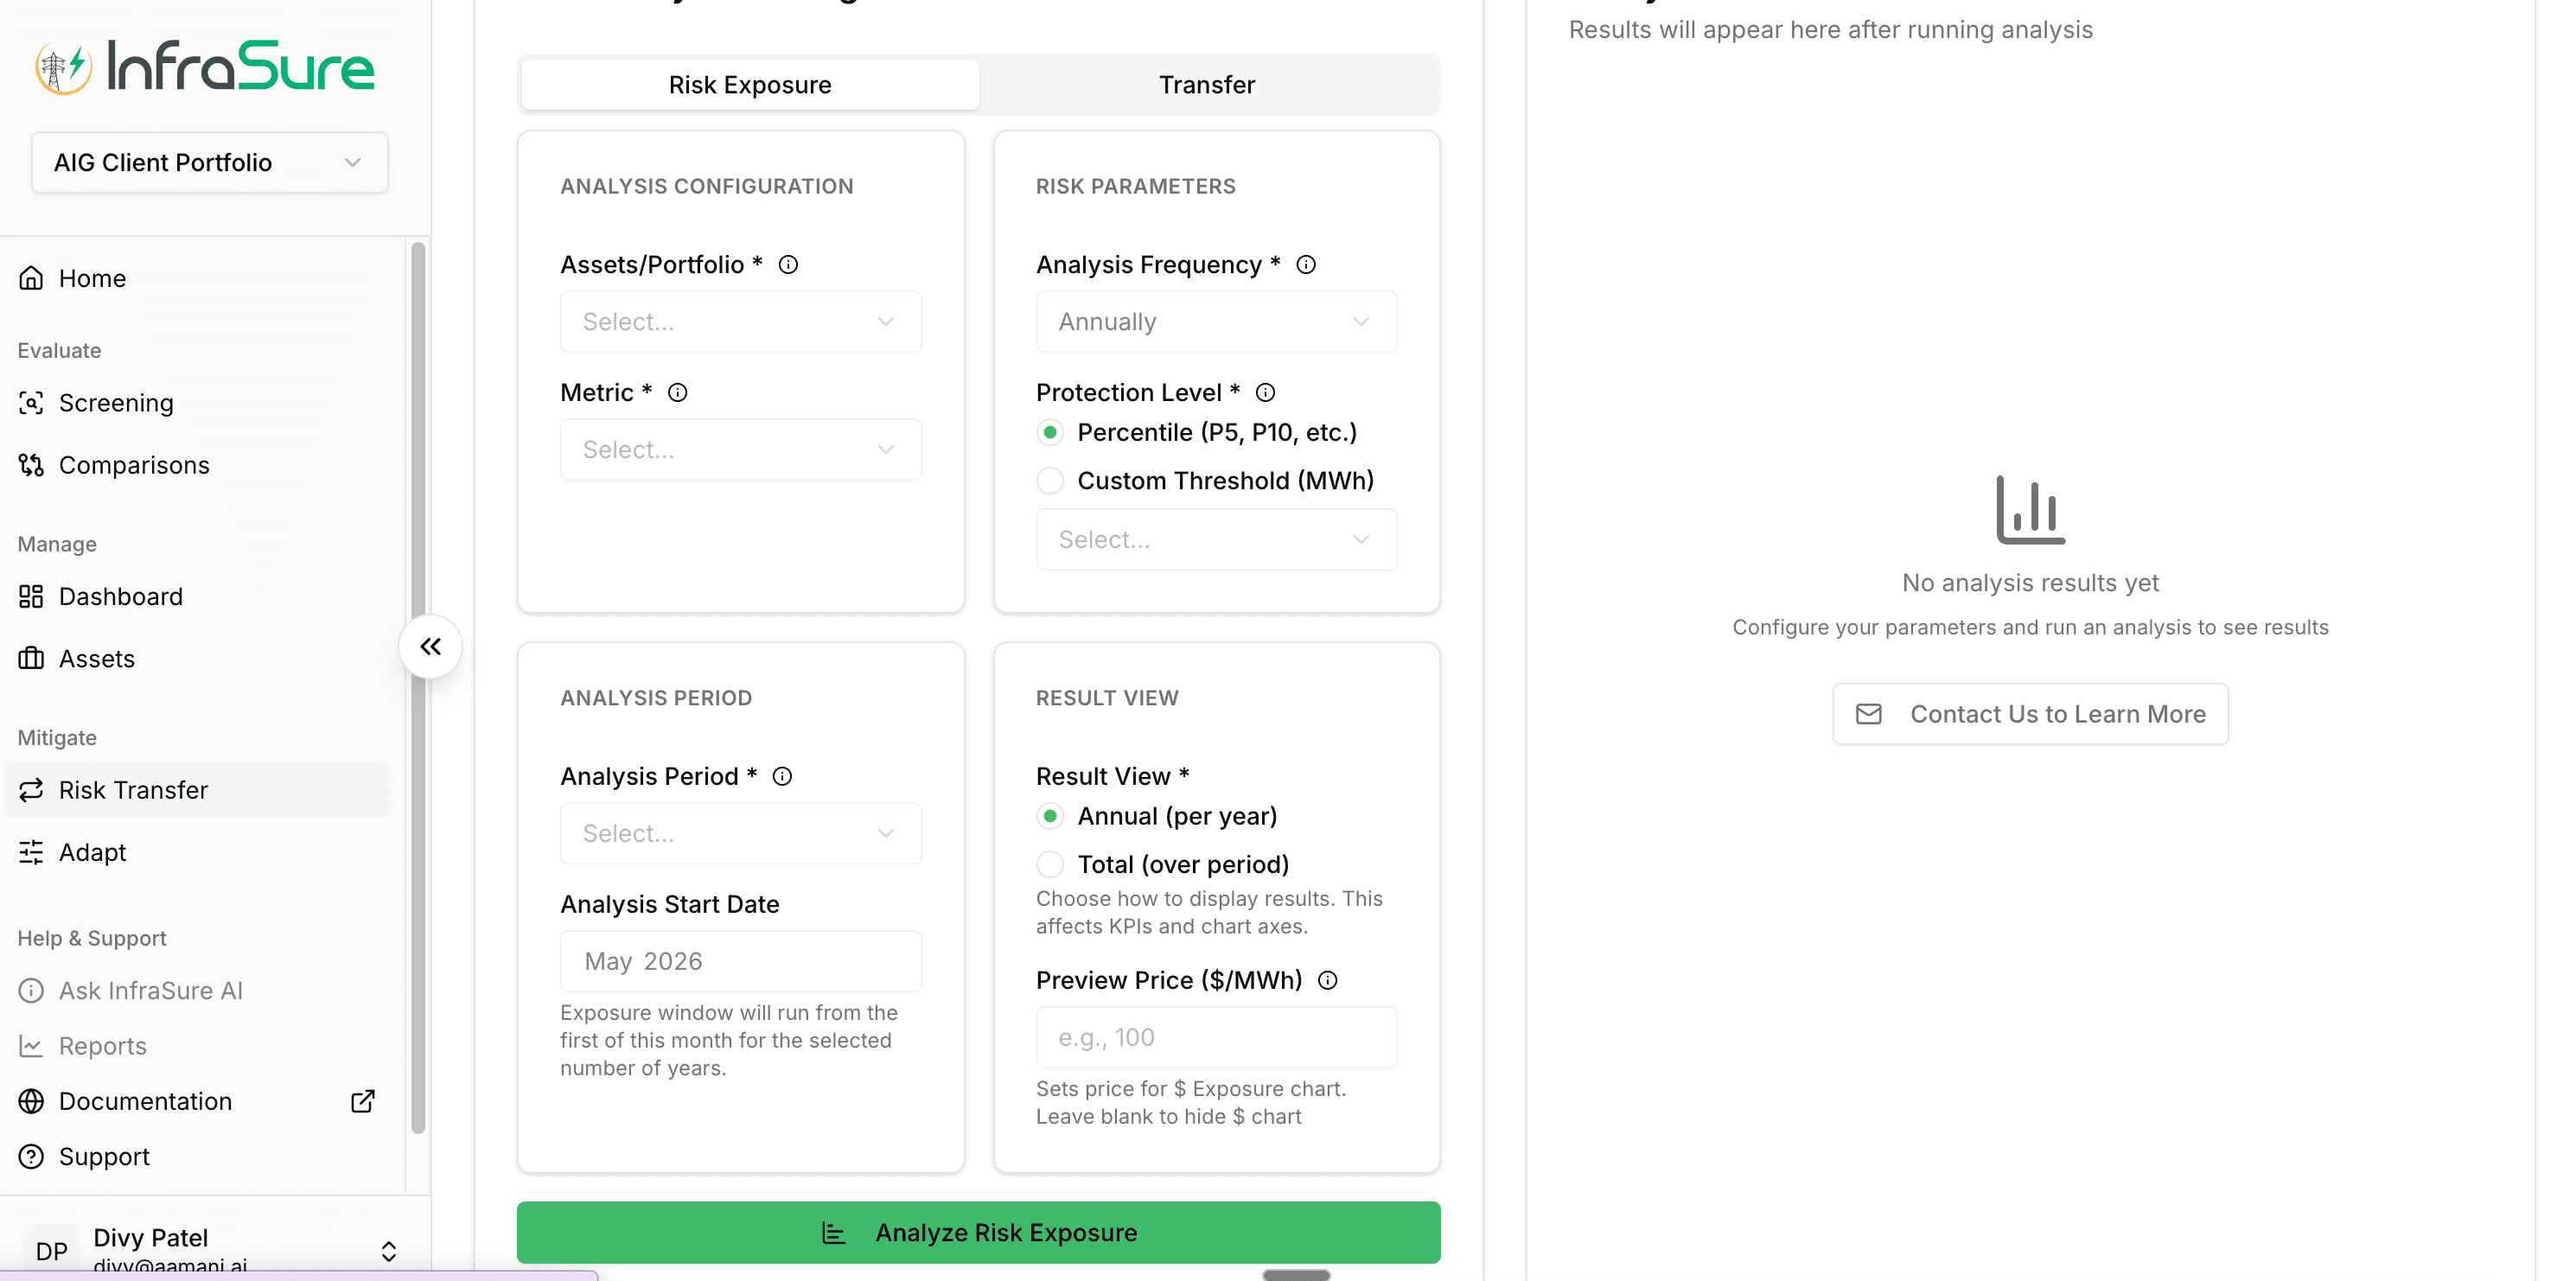
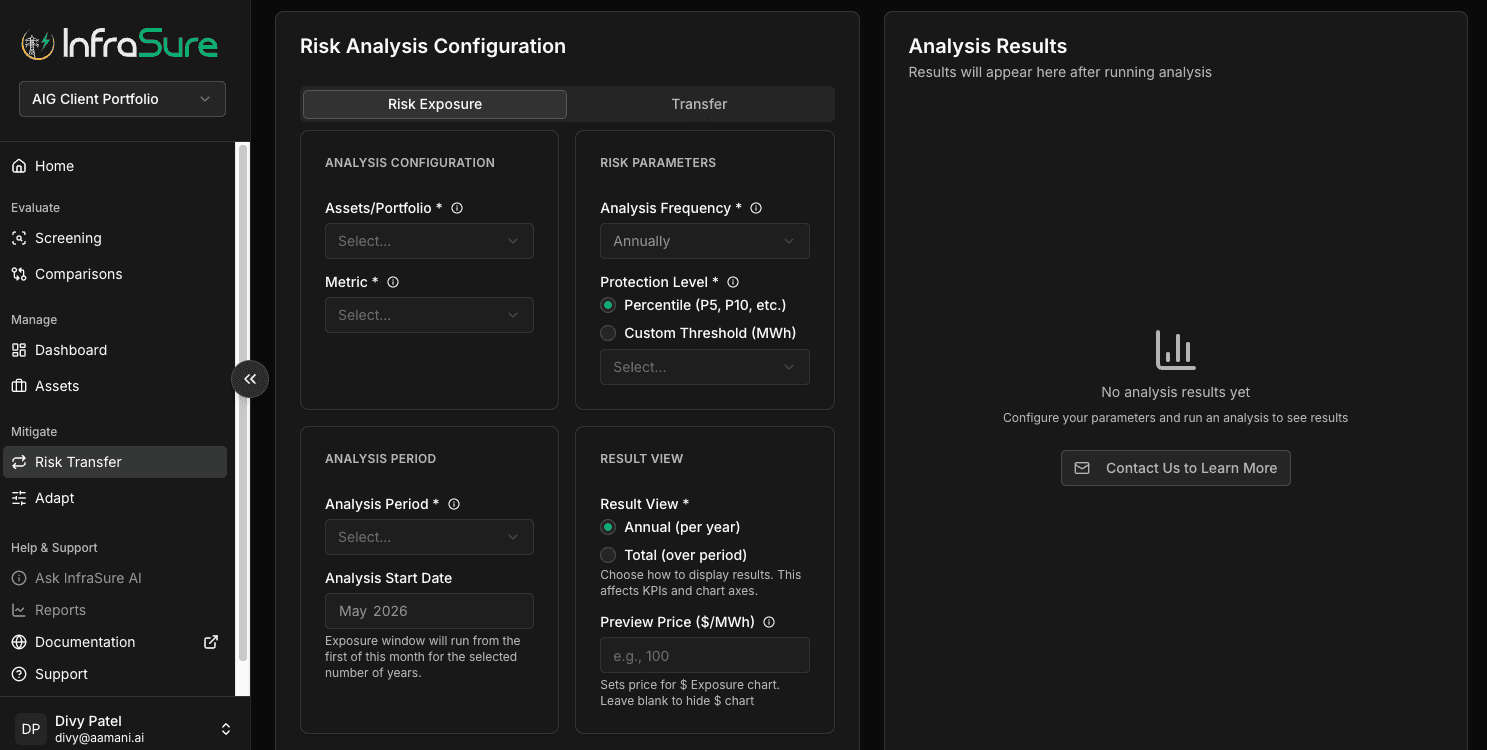
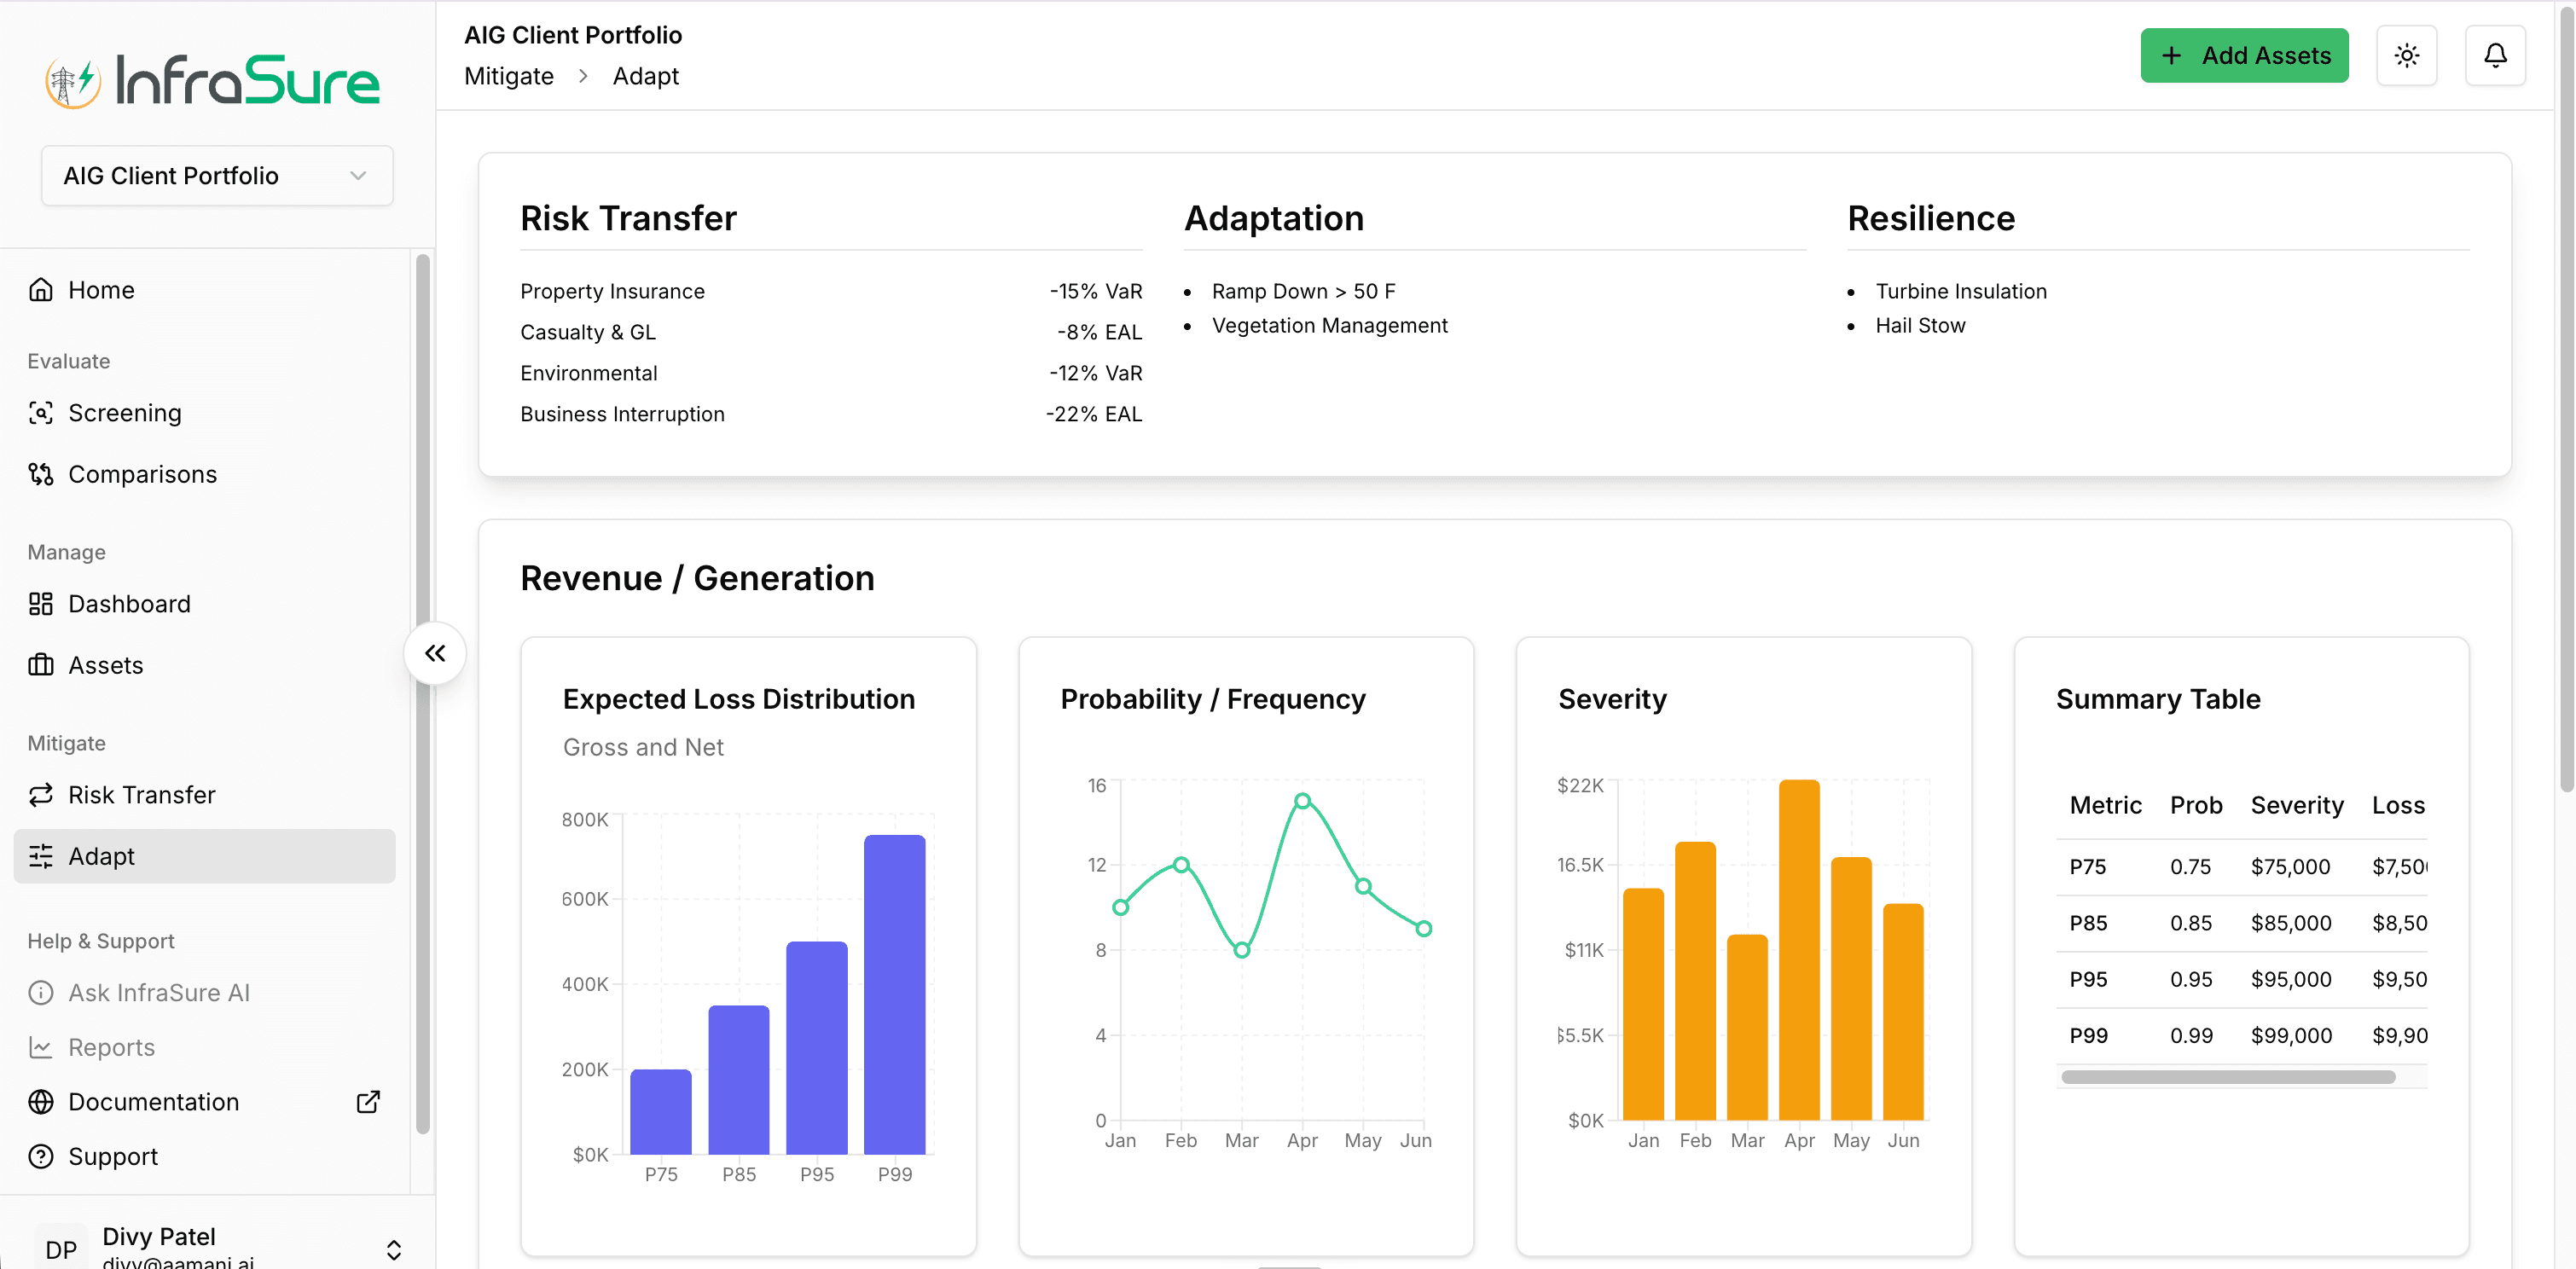
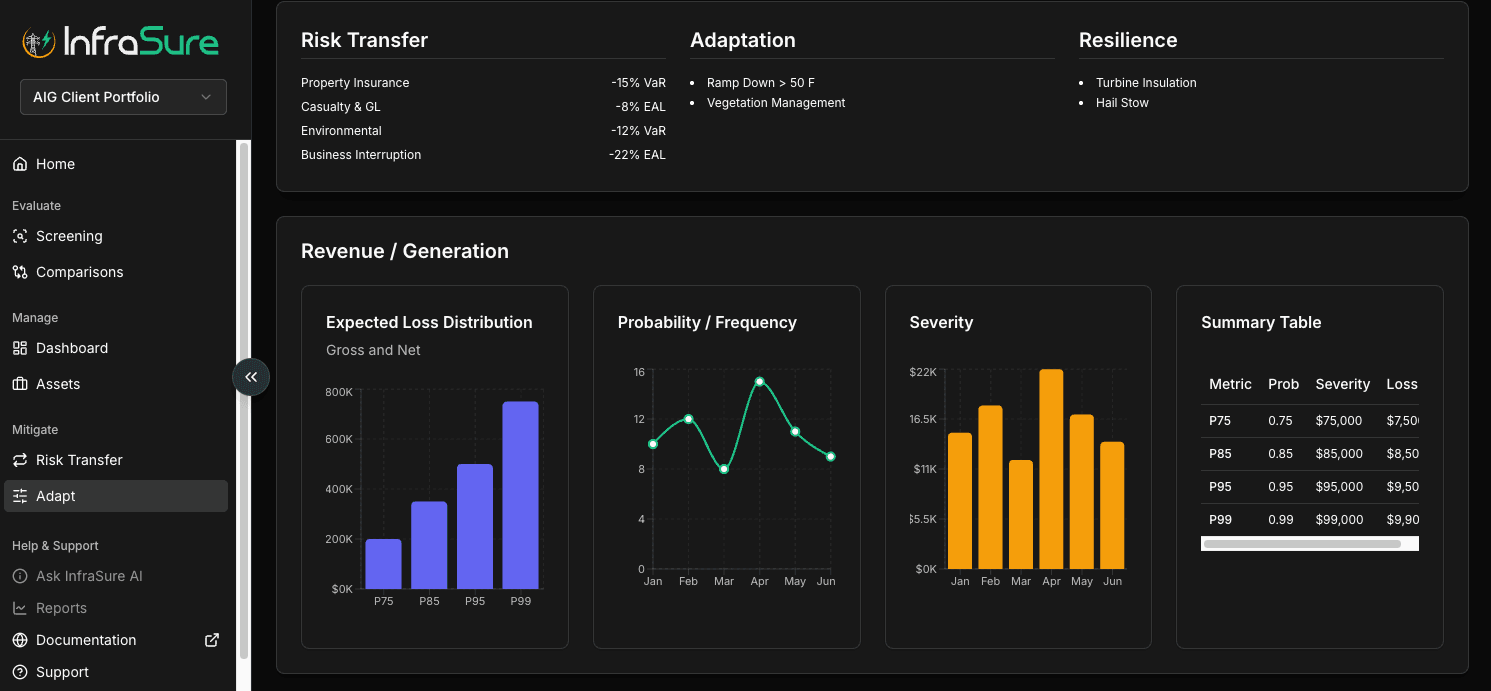
The defining characteristic: the mitigation economics are not separate from the underwriting economics. The parametric trigger is calibrated against the same hazard distribution that drove the DSCR stress.
The advantages compound.
The platform is not a different version of an existing analytical product. It is a different layer of the stack — and the structural advantages don’t add. They compound.
Data Foundation
45 years of ERA5 reanalysis at hourly resolution. CMIP6 climate projections. 8+ years of nodal LMP across CAISO, ERCOT, MISO, PJM, SPP. Full EIA + USPVDB + USWTDB + CEC + NOAA + FEMA integration.
Weather-to-Cashflow Coherence
A single scenario produces simultaneously a hazard outcome, a generation outcome, a revenue outcome, a DSCR outcome, and an insurance trigger — all for the same asset under the same path.
Market-Scale Coverage
Every utility-scale plant in the U.S. — not just owned assets. The benchmark surface widens with every asset added; the gap to second-best compounds with each one.
Validation Discipline
Generation hindcast against EIA monthly actuals (MAE <10%). Hazards calibrated against FEMA NRI. Tail risk cross-checked against TWIA, Verisk, Aon. Backtested against Katrina, Uri, Camp Fire, 2020 Derecho.
Point tools cannot easily traverse this. The advantages compound — and the gap to second-best widens with every asset added.
Built at the intersection of infrastructure investing, climate science, and insurance.
Leadership-level experience across each of the three domains the platform sits at the intersection of — brought together in one team.
Former Portfolio Head, Citadel Infrastructure. Managing Director, Macquarie Bank. 20+ years infrastructure investing.
Former MD & Head of NA Power, Macquarie Capital. JD, Columbia Law. $30B+ in transactions.
PhD Physics, Penn State. ML for climate risk at Gro Intelligence. Signal processing and deep learning.
Christopher Lowell
CPCU, MBA MIT Sloan. Former Head of Innovation, The Hartford. Co-founder, InnSure. MGA structuring expertise.
Geospatial data specialist. 9 years at UC Berkeley building the Cal-Adapt climate platform.
Partners
Hydronos Labs — data partnership. GreenieRE Coalition — climate reinsurance. Columbia University — climate-finance research.
Price the risk before the market does.
We’ll walk you through your own portfolio in 30 minutes — the screening view, the underwriting depth, the mitigation economics. One asset of yours, end to end.